Page 174 - Global Tectonics
P. 174

160   CHAPTER 7


            (a)                                            (b)
                   28    32    36    40    44    48
          20° N                                        20
                                                              5000
                                                              4000                Central MER  A'
                                                              3000  A
          16° N                                        16     2000
                                                            meters  1000 0

          12° N               -40                      12    –1000
                                                             –2000  Topography
                             -50              -30  -20       –3000
               -20              A      -90                       0   50  100  150  200  250  300  350
           8° N         -30  -60                       8                        km
                                       -100
                                       -110  -60  -50         –160
                                   -120
                                    A'   -80  -70  -40
                              -7 0
                                                              –180
                               -80
           4° N                                        4      –200
                                                            mGal  –220
                        -90                                   –240
           0° N                 -100                   0
                                                              –260
                                                                    Bouguer anomaly
                                -110                          –280 0  50  100  150  200  250  300  350
           4° S                            km          -4                        km
                                      0    400   800             0
                              -120                             –10
                                                             km subsurface  –20
           8° S                                        -8
                  28° E  32° E  36° E  40° E  44° E  48° E     –30
                                                               –40
                                                                    Crustal thickness
                                                               –50
                                                                  0   50  100  150  200  250  300  350
                                                                                km
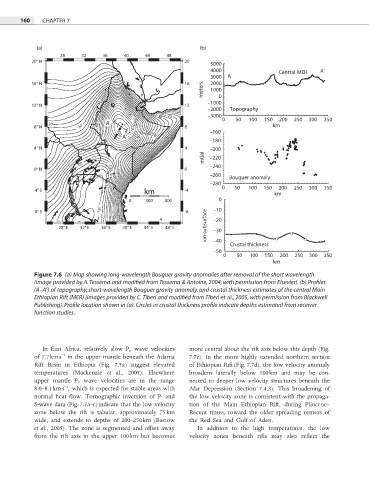
           Figure 7.6  (a) Map showing long-wavelength Bouguer gravity anomalies after removal of the short wavelength

           (image provided by A. Tessema and modified from Tessema & Antoine, 2004, with permission from Elsevier). (b) Profiles

           (A–A′) of topography, short-wavelength Bouguer gravity anomaly, and crustal thickness estimates of the central Main

           Ethiopian Rift (MER) (images provided by C. Tiberi and modified from Tiberi et al., 2005, with permission from Blackwell


           Publishing). Profile location shown in (a). Circles in crustal thickness profile indicate depths estimated from receiver
           function studies.

             In East Africa, relatively slow P n wave velocities   more central about the rift axis below this depth (Fig.
                   −1
           of 7.7 km s  in the upper mantle beneath the Adama   7.7c). In the more highly extended northern section
           Rift Basin in Ethiopia (Fig. 7.5a) suggest elevated   of Ethiopian Rift (Fig. 7.7d), the low velocity anomaly
           temperatures (Mackenzie  et al., 2005). Elsewhere   broadens laterally below 100 km and may be con-
           upper mantle P n  wave velocities are in the range   nected to deeper low velocity structures beneath the
                    −1
           8.0–8.1 km s , which is expected for stable areas with   Afar Depression (Section 7.4.3). This broadening of
           normal heat flow. Tomographic inversion of P- and   the low velocity zone is consistent with the propaga-

           S-wave data (Fig. 7.7a–c) indicate that the low velocity   tion of the Main Ethiopian Rift, during Pliocene–
           zone below the rift is tabular, approximately 75 km   Recent times, toward the older spreading centers of
           wide, and extends to depths of 200–250 km (Bastow   the Red Sea and Gulf of Aden.
           et al., 2005). The zone is segmented and offset away   In addition to the high temperatures, the low
           from the rift axis in the upper 100 km but becomes   velocity zones beneath rifts may also refl ect  the
   169   170   171   172   173   174   175   176   177   178   179