
Page 232 - Global Tectonics
P. 232
122°00
(a) 122°00 Explanation
rx Concord rx
N Qa Undifferentiated alluvium
QT lg Plio - Pleistocene Livermore
Qa gravels
Tt Pliocene Tassajara Fm.
Qa Ts Miocene Sycamore Fm.
Concord fault
rx Undifferentiated older rocks
rx Clayton-Marsh Creek fault zone Emergent thrust fault
rx Mt. Diablo anticline “Blind” thrust fault
Walnut Mt. Diablo Late Pleistocene fault; dashed
Creek (1173m) where approximately located;
dotted where concealed
rx Late Cenozoic fault
Ts
Ts
Anticline axis
rx
East Qa
Qa
Qa 0 5 10 km
Ts
Ts
Tassajara
Tassajara
Ts
Ts
Bay Altamont
37°45 Anticline 37°45
Anticline
rx Mt. Diablo
Mt. Diablo
fault
fault
Tt Tt Greenville fault Hills
Hills Tt Tt Tt Tt
Dublin Qa
Pleasanton Livermore
?
Qa Qa
Calaveras fault
QT lg Qa QT lg
122°00 121°45
122°W 38°N 37°N
(b) INSET
Rodgers Creek Calaveras Fault Coyote Lake
Fault
Hayward Fault
San Francisco N
Bay
10 km
38°N 122°W 37°N
122°00 W
Greenville Fault
Concord Fault
MD
Calaveras Fault
MH
Hayward Fault
Fixed
122°30 W
San Francisco
San Francisco
38°00 N Bay SCM
Bay
San Andreas Fault
Pacific Ocean
Pacific Ocean
2 mm a
2 mm a 1 1
123°00 W
1.
0.5
2.02.0 1.5 1.0 0.5 0.0 0. 0. 5 5 1. 0 0 1. 5 5 2. 2. 00
1.
1.0
0.0
1.5
1
1992–2000 range-rate residuals (mm a ) 1 )
1992–2000 range-rate residuals (mm a
37°30 N 123°00 W 37°00 N 122°30 W
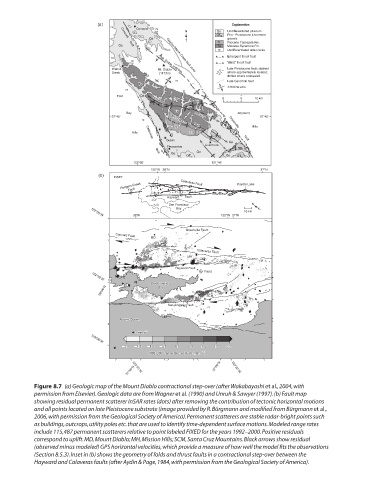
Figure 8.7 (a) Geologic map of the Mount Diablo contractional step-over (after Wakabayashi et al., 2004, with
permission from Elsevier). Geologic data are from Wagner et al. (1990) and Unruh & Sawyer (1997). (b) Fault map
showing residual permanent scatterer InSAR rates (dots) after removing the contribution of tectonic horizontal motions
and all points located on late Pleistocene substrate (image provided by R. Bürgmann and modified from Bürgmann et al.,
2006, with permission from the Geological Society of America). Permanent scatterers are stable radar-bright points such
as buildings, outcrops, utility poles etc. that are used to identify time-dependent surface motions. Modeled range rates
include 115,487 permanent scatterers relative to point labeled FIXED for the years 1992–2000. Positive residuals
correspond to uplift. MD, Mount Diablo; MH, Mission Hills; SCM, Santa Cruz Mountains. Black arrows show residual
(observed minus modeled) GPS horizontal velocities, which provide a measure of how well the model fits the observations
(Section 8.5.3). Inset in (b) shows the geometry of folds and thrust faults in a contractional step-over between the
Hayward and Calaveras faults (after Aydin & Page, 1984, with permission from the Geological Society of America).