
Page 328 - Handbook Of Multiphase Flow Assurance
P. 328
Computer modeling of interaction between a hydrate surface and an inhibitor 327
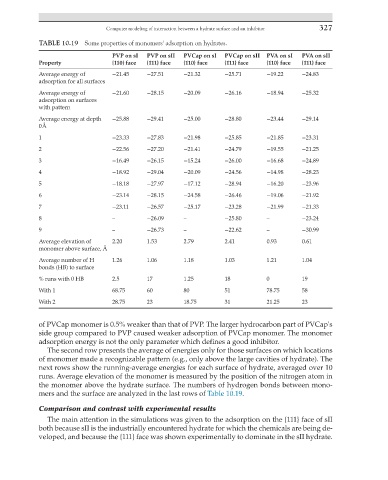
TABLE 10.19 Some properties of monomers' adsorption on hydrates.
PVP on sI PVP on sII PVCap on sI PVCap on sII PVA on sI PVA on sII
Property {110} face {111} face {110} face {111} face {110} face {111} face
Average energy of −21.45 −27.51 −21.32 −25.71 −19.22 −24.83
adsorption for all surfaces
Average energy of −21.60 −28.15 −20.09 −26.16 −18.94 −25.32
adsorption on surfaces
with pattern
Average energy at depth −25.88 −29.41 −25.00 −28.80 −23.44 −29.14
0 Å
1 −23.33 −27.83 −21.98 −25.85 −21.85 −23.31
2 −22.56 −27.20 −21.41 −24.79 −19.55 −21.25
3 −16.49 −26.15 −15.24 −26.00 −16.68 −24.89
4 −18.92 −29.04 −20.09 −24.56 −14.98 −28.23
5 −18.18 −27.97 −17.12 −28.94 −16.20 −23.96
6 −23.14 −28.15 −24.58 −26.46 −19.06 −21.92
7 −23.11 −26.57 −25.17 −23.28 −21.99 −21.33
8 – −26.09 – −25.80 – −23.24
9 – −26.73 – −22.62 – −30.99
Average elevation of 2.20 1.53 2.79 2.41 0.93 0.61
monomer above surface, Å
Average number of H 1.26 1.06 1.18 1.03 1.21 1.04
bonds (HB) to surface
% runs with 0 HB 2.5 17 1.25 18 0 19
With 1 68.75 60 80 51 78.75 58
With 2 28.75 23 18.75 31 21.25 23
of PVCap monomer is 0.5% weaker than that of PVP. The larger hydrocarbon part of PVCap's
side group compared to PVP caused weaker adsorption of PVCap monomer. The monomer
adsorption energy is not the only parameter which defines a good inhibitor.
The second row presents the average of energies only for those surfaces on which locations
of monomer made a recognizable pattern (e.g., only above the large cavities of hydrate). The
next rows show the running-average energies for each surface of hydrate, averaged over 10
runs. Average elevation of the monomer is measured by the position of the nitrogen atom in
the monomer above the hydrate surface. The numbers of hydrogen bonds between mono-
mers and the surface are analyzed in the last rows of Table 10.19.
Comparison and contrast with experimental results
The main attention in the simulations was given to the adsorption on the {111} face of sII
both because sII is the industrially encountered hydrate for which the chemicals are being de-
veloped, and because the {111} face was shown experimentally to dominate in the sII hydrate.