
Page 236 - Handbook of Battery Materials
P. 236
7.3 Physical Properties of the Bromine Storage Phase 205
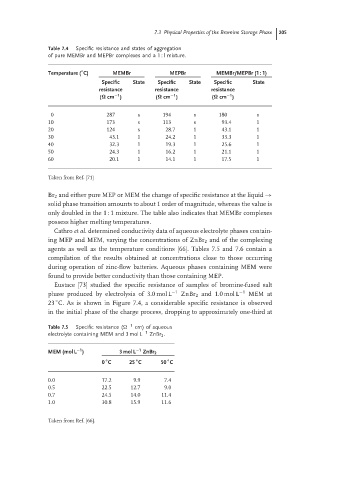
Table 7.4 Specific resistance and states of aggregation
of pure MEMBr and MEPBr complexes and a 1 : l mixture.
◦
Temperature ( C) MEMBr MEPBr MEMBr/MEPBr (1 : 1)
Specific State Specific State Specific State
resistance resistance resistance
−1
−1
−1
(Ω cm ) (Ω cm ) (Ω cm )
0 287 s 194 s 180 s
10 173 s 113 s 93.4 1
20 124 s 28.7 1 43.1 1
30 43.1 1 24.2 1 33.3 1
40 32.3 1 19.3 1 25.6 1
50 24.3 1 16.2 1 21.1 1
60 20.1 1 14.1 1 17.5 1
Taken from Ref. [71]
Br 2 and either pure MEP or MEM the change of specific resistance at the liquid →
solid phase transition amounts to about 1 order of magnitude, whereas the value is
only doubled in the 1 : 1 mixture. The table also indicates that MEMBr complexes
possess higher melting temperatures.
Cathro et al. determined conductivity data of aqueous electrolyte phases contain-
ing MEP and MEM, varying the concentrations of ZnBr 2 and of the complexing
agents as well as the temperature conditions [66]. Tables 7.5 and 7.6 contain a
compilation of the results obtained at concentrations close to those occurring
during operation of zinc-flow batteries. Aqueous phases containing MEM were
found to provide better conductivity than those containing MEP.
Eustace [73] studied the specific resistance of samples of bromine-fused salt
phase produced by electrolysis of 3.0 mol L −1 ZnBr 2 and 1.0 mol L −1 MEM at
◦
23 C. As is shown in Figure 7.4, a considerable specific resistance is observed
in the initial phase of the charge process, dropping to approximately one-third at
Table 7.5 Specific resistance ( −1 cm) of aqueous
electrolyte containing MEM and 3 mol L −1 ZnBr 2 .
−1
MEM (mol L ) 3 mol L −1 ZnBr 2
◦
◦
◦
0 C 25 C 50 C
0.0 17.2 9.9 7.4
0.5 22.5 12.7 9.0
0.7 24.5 14.0 11.4
1.0 30.8 15.9 11.6
Taken from Ref. [66].