
Page 237 - Handbook of Battery Materials
P. 237
206 7 Bromine-Storage Materials
Table 7.6 Specific resistance of aqueous electrolyte
◦
containing MEM or MEP at 25 C.
−1
−1
Concentration (mol L ) Specific resistance (Ω cm )
ZnBr 2 QBr QBr = MEP QBr = MEM
1 0.3 11.4 9.8
2 0.65 12.1 11.2
3 1.0 16.5 15.9
Taken from Ref. [66].
80
70
specific resistance / Ohm cm 50
60
40
30
20
10 20 30 40 50 60 70 80
Zn utilization / %
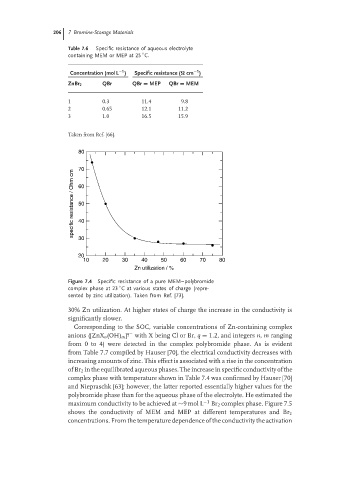
Figure 7.4 Specific resistance of a pure MEM–polybromide
◦
complex phase at 23 C at various states of charge (repre-
sented by zinc utilization). Taken from Ref. [73].
30% Zn utilization. At higher states of charge the increase in the conductivity is
significantly slower.
Corresponding to the SOC, variable concentrations of Zn-containing complex
anions ([ZnX n (OH) m ] q− with X being Cl or Br, q = 1.2, and integers n, m ranging
from 0 to 4) were detected in the complex polybromide phase. As is evident
from Table 7.7 compiled by Hauser [70], the electrical conductivity decreases with
increasing amounts of zinc. This effect is associated with a rise in the concentration
of Br 2 in the equilibrated aqueous phases. The increase in specific conductivity of the
complex phase with temperature shown in Table 7.4 was confirmed by Hauser [70]
and Niepraschk [63]; however, the latter reported essentially higher values for the
polybromide phase than for the aqueous phase of the electrolyte. He estimated the
maximum conductivity to be achieved at ∼9mol L −1 Br 2 complex phase. Figure 7.5
shows the conductivity of MEM and MEP at different temperatures and Br 2
concentrations. From the temperature dependence of the conductivity the activation