
Page 282 - Handbook of Battery Materials
P. 282
252 9 Metal Hydride Electrodes
350
300
250
Capacity Q, mAh/g 200 MmNi4.3Mn.4Al.3 e195
Mm*Ni4.3Mn.4Al.3e194
150
Mm*Ni3.55Co.75Mn.4Al.3 e125
MmNi3.55Co.75Mn.4Al.3 e24
100
50
0
0 100 200 300 400 500 600
Cycles
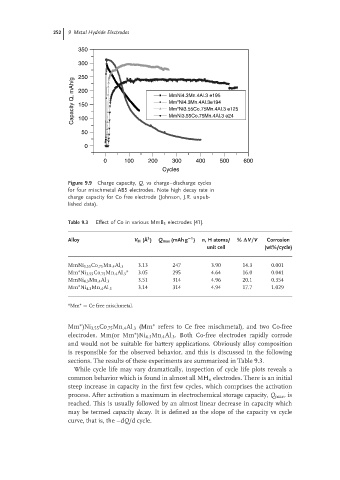
Figure 9.9 Charge capacity, Q, vs charge–discharge cycles
for four mischmetal AB5 electrodes. Note high decay rate in
charge capacity for Co free electrode (Johnson, J.R. unpub-
lished data).
Table 9.3 Effect of Co in various MmB 5 electrodes [41].
3
−1
Alloy V H ( ˚ A ) Q max (mAh g ) n,H atoms/ % ∆V/V Corrosion
unit cell (wt%/cycle)
MmNi 3.55 Co .75 Mn .4 Al .3 3.13 247 3.90 14.3 0.001
∗ a 3.05 295 4.64 16.0 0.041
Mm Ni 3.55 Co .75 Mn .4 Al .3
MmNi 4.3 Mn .4 Al .3 3.51 314 4.96 20.1 0.354
∗ 3.14 314 4.94 17.7 1.029
Mm Ni 4.3 Mn .4 Al .3
a ∗
Mm = Ce free mischmetal.
∗
Mm )Ni 3.55 Co .75 Mn .4 Al .3 (Mm refers to Ce free mischmetal), and two Co-free
∗
electrodes, Mm(or Mm )Ni 4.3 Mn .4 Al .3 . Both Co-free electrodes rapidly corrode
∗
and would not be suitable for battery applications. Obviously alloy composition
is responsible for the observed behavior, and this is discussed in the following
sections. The results of these experiments are summarized in Table 9.3.
While cycle life may vary dramatically, inspection of cycle life plots reveals a
common behavior which is found in almost all MH x electrodes. There is an initial
steep increase in capacity in the first few cycles, which comprises the activation
process. After activation a maximum in electrochemical storage capacity, Q max ,is
reached. This is usually followed by an almost linear decrease in capacity which
may be termed capacity decay. It is defined as the slope of the capacity vs cycle
curve, that is, the –dQ/d cycle.