
Page 17 - Handbook of Materials Failure Analysis
P. 17
3 Case Studies 9
Outer tube surface
Shear lip
Inner tube surface
3 mm
FIGURE 1.3
Optical stereomicrograph depicting the fracture surface of the ruptured tube.
Elongated dimples
Acc.V Spot Magn Det WD 50 µm Acc.V Spot Magn Det WD 50 µm
20.0 kV 3.0 500x SE 4.2 20.0 kV 3.0 500x SE 17.4
(a) (b)
Ductile tearing
Transgranular facets
Slip bands
Acc.V Spot Magn Det WD 20 µm
20.0 kV 3.0 1000x SE 17.3
(c)
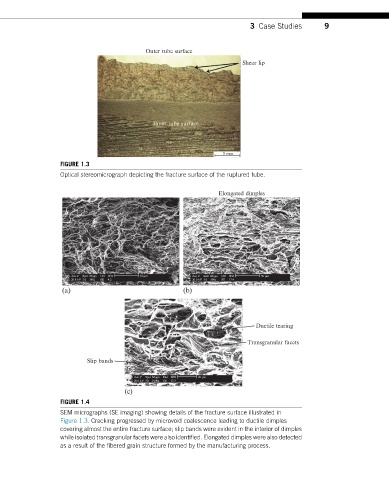
FIGURE 1.4
SEM micrographs (SE imaging) showing details of the fracture surface illustrated in
Figure 1.3. Cracking progressed by microvoid coalescence leading to ductile dimples
covering almost the entire fracture surface; slip bands were evident in the interior of dimples
while isolated transgranular facets were also identified. Elongated dimples were also detected
as a result of the fibered grain structure formed by the manufacturing process.