
Page 177 - Handbook of Materials Failure Analysis
P. 177
6 Results and Discussion 173
8000
a/W = 0.1
a/W = 0.2
6000 a/W = 0.3
a/W = 0.4
Load (N) 4000 a/W = 0.5
2000
0
0 10 20 30 40
Displacement (mm)
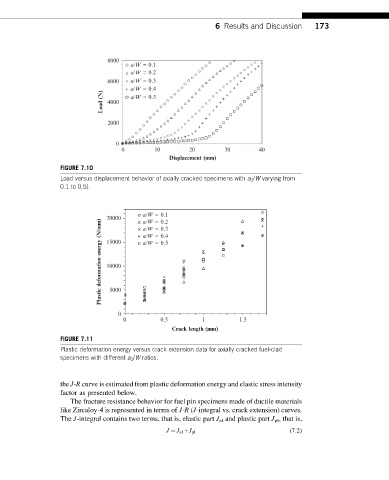
FIGURE 7.10
Load versus displacement behavior of axially cracked specimens with a 0 /W varying from
0.1 to 0.5).
a/W = 0.1
20000 a/W = 0.2
Plastic deformation energy (N/mm) 15000 a/W = 0.5
a/W = 0.3
a/W = 0.4
10000
5000
0
0 0.5 1 1.5
Crack length (mm)
FIGURE 7.11
Plastic deformation energy versus crack extension data for axially cracked fuel-clad
specimens with different a 0 /W ratios.
the J-R curve is estimated from plastic deformation energy and elastic stress intensity
factor as presented below.
The fracture resistance behavior for fuel pin specimens made of ductile materials
like Zircaloy-4 is represented in terms of J-R (J-integral vs. crack extension) curves.
The J-integral contains two terms, that is, elastic part J el and plastic part J pl , that is,
J ¼ J el + J pl (7.2)