
Page 181 - Handbook of Materials Failure Analysis
P. 181
6 Results and Discussion 177
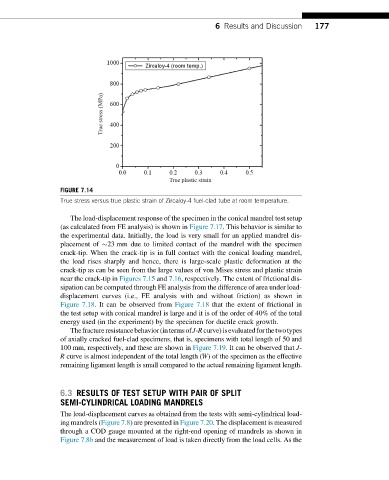
FIGURE 7.14
True stress versus true plastic strain of Zircaloy-4 fuel-clad tube at room temperature.
The load-displacement response of the specimen in the conical mandrel test setup
(as calculated from FE analysis) is shown in Figure 7.17. This behavior is similar to
the experimental data. Initially, the load is very small for an applied mandrel dis-
placement of 23 mm due to limited contact of the mandrel with the specimen
crack-tip. When the crack-tip is in full contact with the conical loading mandrel,
the load rises sharply and hence, there is large-scale plastic deformation at the
crack-tip as can be seen from the large values of von Mises stress and plastic strain
near the crack-tip in Figures 7.15 and 7.16, respectively. The extent of frictional dis-
sipation can be computed through FE analysis from the difference of area under load-
displacement curves (i.e., FE analysis with and without friction) as shown in
Figure 7.18. It can be observed from Figure 7.18 that the extent of frictional in
the test setup with conical mandrel is large and it is of the order of 40% of the total
energy used (in the experiment) by the specimen for ductile crack growth.
Thefractureresistancebehavior(intermsofJ-Rcurve)isevaluatedforthetwotypes
of axially cracked fuel-clad specimens, that is, specimens with total length of 50 and
100 mm, respectively, and these are shown in Figure 7.19. It can be observed that J-
R curve is almost independent of the total length (W) of the specimen as the effective
remaining ligament length is small compared to the actual remaining ligament length.
6.3 RESULTS OF TEST SETUP WITH PAIR OF SPLIT
SEMI-CYLINDRICAL LOADING MANDRELS
The load-displacement curves as obtained from the tests with semi-cylindrical load-
ing mandrels (Figure 7.8) are presented in Figure 7.20. The displacement is measured
through a COD gauge mounted at the right-end opening of mandrels as shown in
Figure 7.8b and the measurement of load is taken directly from the load cells. As the