
Page 186 - Handbook of Materials Failure Analysis
P. 186
182 CHAPTER 7 Investigation of failure behavior of tubular components
2 3
ð
ð
ð
Ca=WÞ ¼ 0:01752 + 0:10473 a=WÞ 0:20424 a=WÞ +0:13573 a=WÞ (7.9)
ð
The final load-displacement pair corresponding to the end of loading is also normal-
ized using the same equations as described above except that the final measured
0
crack size a (after the specimen is break-open) is used instead of the crack size eval-
f
uated using the normalization curve.
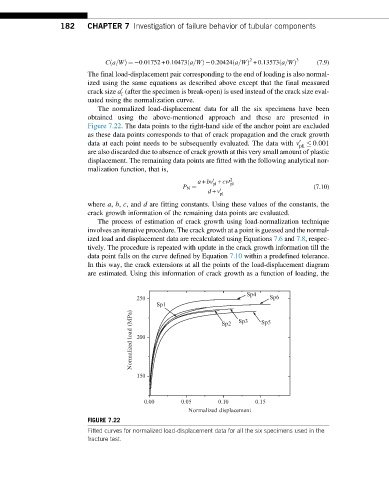
The normalized load-displacement data for all the six specimens have been
obtained using the above-mentioned approach and these are presented in
Figure 7.22. The data points to the right-hand side of the anchor point are excluded
as these data points corresponds to that of crack propagation and the crack growth
data at each point needs to be subsequently evaluated. The data with v 0:001
0
pli
are also discarded due to absence of crack growth at this very small amount of plastic
displacement. The remaining data points are fitted with the following analytical nor-
malization function, that is,
0 2
a + bv + cv0
pl pl
P N ¼ (7.10)
d + v 0 pl
where a, b, c, and d are fitting constants. Using these values of the constants, the
crack growth information of the remaining data points are evaluated.
The process of estimation of crack growth using load-normalization technique
involves an iterative procedure. The crack growth at a point is guessed and the normal-
ized load and displacement data are recalculated using Equations 7.6 and 7.8,respec-
tively. The procedure is repeated with update in the crack growth information till the
data point falls on the curve defined by Equation 7.10 within a predefined tolerance.
In this way, the crack extensions at all the points of the load-displacement diagram
are estimated. Using this information of crack growth as a function of loading, the
Sp4
250 Sp6
Sp1 Sp3 Sp5
Normalized load (MPa) 200 Sp2
150
0.00 0.05 0.10 0.15
Normalized displacement
FIGURE 7.22
Fitted curves for normalized load-displacement data for all the six specimens used in the
fracture test.