
Page 187 - Handbook of Materials Failure Analysis
P. 187
6 Results and Discussion 183
RXA_Sp1
500 RXA_Sp2
RXA_Sp3
RXA_Sp4
J-integral (N/mm) 300 SRA_Sp1
400
SRA_Sp2
SRA_Sp3
SRA_Sp4
200
100 SRA_Sp5
0
0.0 0.2 0.4 0.6
Crack growth (mm)
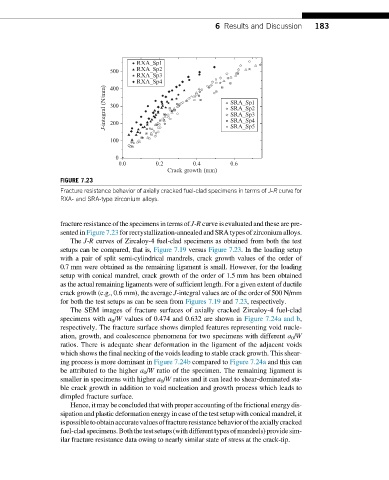
FIGURE 7.23
Fracture resistance behavior of axially cracked fuel-clad specimens in terms of J-R curve for
RXA- and SRA-type zirconium alloys.
fracture resistance of the specimens in terms of J-R curve is evaluated and these are pre-
sented in Figure 7.23 for recrystallization-annealed and SRA types of zirconium alloys.
The J-R curves of Zircaloy-4 fuel-clad specimens as obtained from both the test
setups can be compared, that is, Figure 7.19 versus Figure 7.23.Inthe loadingsetup
with a pair of split semi-cylindrical mandrels, crack growth values of the order of
0.7 mm were obtained as the remaining ligament is small. However, for the loading
setup with conical mandrel, crack growth of the order of 1.5 mm has been obtained
as the actual remaining ligaments were of sufficient length. For a given extent of ductile
crack growth (e.g., 0.6 mm), the average J-integral values are of the order of 500 N/mm
for both the test setups as can be seen from Figures 7.19 and 7.23, respectively.
The SEM images of fracture surfaces of axially cracked Zircaloy-4 fuel-clad
specimens with a 0 /W values of 0.474 and 0.632 are shown in Figure 7.24a and b,
respectively. The fracture surface shows dimpled features representing void nucle-
ation, growth, and coalescence phenomena for two specimens with different a 0 /W
ratios. There is adequate shear deformation in the ligament of the adjacent voids
which shows the final necking of the voids leading to stable crack growth. This shear-
ing process is more dominant in Figure 7.24b compared to Figure 7.24a and this can
be attributed to the higher a 0 /W ratio of the specimen. The remaining ligament is
smaller in specimens with higher a 0 /W ratios and it can lead to shear-dominated sta-
ble crack growth in addition to void nucleation and growth process which leads to
dimpled fracture surface.
Hence, it may be concluded that with proper accounting of the frictional energy dis-
sipation and plastic deformation energy in case of the test setup with conical mandrel, it
ispossibletoobtainaccuratevaluesoffractureresistancebehavioroftheaxiallycracked
fuel-cladspecimens.Boththetestsetups(withdifferenttypes ofmandrels)providesim-
ilar fracture resistance data owing to nearly similar state of stress at the crack-tip.