
Page 184 - Handbook of Materials Failure Analysis
P. 184
180 CHAPTER 7 Investigation of failure behavior of tubular components
1200
L = 50
1000 L = 100
800
J (N/mm) 600
400
200
0
0 0.25 0.5 0.75 1 1.25 1.5
Crack length (mm)
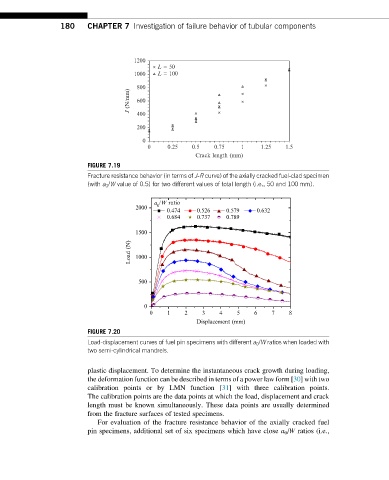
FIGURE 7.19
Fracture resistance behavior (in terms of J-R curve) of the axially cracked fuel-clad specimen
(with a 0 /W value of 0.5) for two different values of total length (i.e., 50 and 100 mm).
a /W ratio
2000 0
0.474 0.526 0.579 0.632
0.684 0.737 0.789
1500
Load (N) 1000
500
0
0 1 2 3 4 5 6 7 8
Displacement (mm)
FIGURE 7.20
Load-displacement curves of fuel pin specimens with different a 0 /W ratios when loaded with
two semi-cylindrical mandrels.
plastic displacement. To determine the instantaneous crack growth during loading,
the deformation function can be described in terms of a power law form [30] with two
calibration points or by LMN function [31] with three calibration points.
The calibration points are the data points at which the load, displacement and crack
length must be known simultaneously. These data points are usually determined
from the fracture surfaces of tested specimens.
For evaluation of the fracture resistance behavior of the axially cracked fuel
pin specimens, additional set of six specimens which have close a 0 /W ratios (i.e.,