
Page 185 - Handbook of Materials Failure Analysis
P. 185
6 Results and Discussion 181
Sp2
1000 Sp5
Sp6
Sp1
800 Sp4
Sp3
Load (N) 600
400
200
0
0.0 0.5 1.0 1.5 2.0 2.5 3.0 3.5
Displacement (mm)
FIGURE 7.21
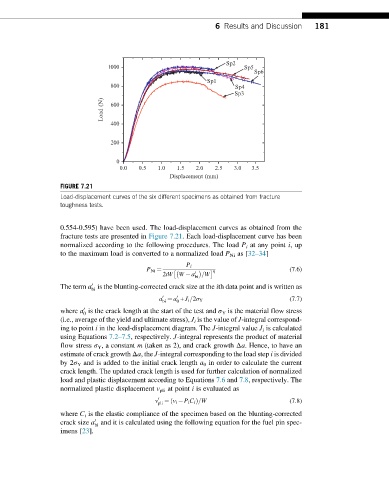
Load-displacement curves of the six different specimens as obtained from fracture
toughness tests.
0.554-0.595) have been used. The load-displacement curves as obtained from the
fracture tests are presented in Figure 7.21. Each load-displacement curve has been
normalized according to the following procedures. The load P i at any point i,up
to the maximum load is converted to a normalized load P Ni as [32–34]
P i
P Ni ¼ η (7.6)
2tW W a 0 bi =W
0
The term a is the blunting-corrected crack size at the ith data point and is written as
bi
0 0
a ¼ a + J i =2σ Y (7.7)
bi
0
0
where a is the crack length at the start of the test and σ Y is the material flow stress
0
(i.e., average of the yield and ultimate stress), J i is the value of J-integral correspond-
ing to point i in the load-displacement diagram. The J-integral value J i is calculated
using Equations 7.2–7.5, respectively. J-integral represents the product of material
flow stress σ Y , a constant m (taken as 2), and crack growth Δa. Hence, to have an
estimate of crack growth Δa, the J-integral corresponding to the load step i is divided
by 2σ Y and is added to the initial crack length a 0 in order to calculate the current
crack length. The updated crack length is used for further calculation of normalized
load and plastic displacement according to Equations 7.6 and 7.8, respectively. The
normalized plastic displacement v pli at point i is evaluated as
0
v ¼ v i P i C i Þ=W (7.8)
ð
pli
where C i is the elastic compliance of the specimen based on the blunting-corrected
crack size a and it is calculated using the following equation for the fuel pin spec-
0
bi
imens [23].