
Page 308 - Handbook of Materials Failure Analysis
P. 308
304 CHAPTER 12 A nonlocal damage-mechanics-based approach
400
1TCT (P =0.05)
f
Fracture toughness K JC (MPa m) 200 2TCT (P =0.50)
1TCT (P =0.50)
f
1TCT (P =0.95)
f
300
2TCT (P =0.05)
f
f
2TCT (P =0.95)
f
4TCT (P =0.05)
f
4TCT (P =0.50)
f
4TCT (P =0.95)
f
100
0
–100 –80 –60 –40 –20
Temperature (°C)
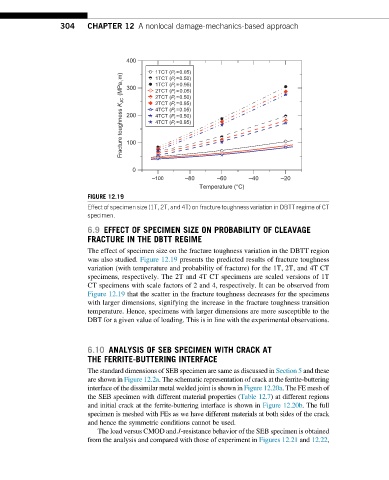
FIGURE 12.19
Effect of specimen size (1T, 2T, and 4T) on fracture toughness variation in DBTT regime of CT
specimen.
6.9 EFFECT OF SPECIMEN SIZE ON PROBABILITY OF CLEAVAGE
FRACTURE IN THE DBTT REGIME
The effect of specimen size on the fracture toughness variation in the DBTT region
was also studied. Figure 12.19 presents the predicted results of fracture toughness
variation (with temperature and probability of fracture) for the 1T, 2T, and 4T CT
specimens, respectively. The 2T and 4T CT specimens are scaled versions of 1T
CT specimens with scale factors of 2 and 4, respectively. It can be observed from
Figure 12.19 that the scatter in the fracture toughness decreases for the specimens
with larger dimensions, signifying the increase in the fracture toughness transition
temperature. Hence, specimens with larger dimensions are more susceptible to the
DBT for a given value of loading. This is in line with the experimental observations.
6.10 ANALYSIS OF SEB SPECIMEN WITH CRACK AT
THE FERRITE-BUTTERING INTERFACE
The standard dimensions of SEB specimen are same as discussed in Section 5 and these
are shown in Figure 12.2a. The schematic representation of crack at the ferrite-buttering
interface of the dissimilar metal welded joint is shown in Figure 12.20a. The FE mesh of
the SEB specimen with different material properties (Table 12.7) at different regions
and initial crack at the ferrite-buttering interface is shown in Figure 12.20b.The full
specimen is meshed with FEs as we have different materials at both sides of the crack
and hence the symmetric conditions cannot be used.
The load versus CMOD and J-resistance behavior of the SEB specimen is obtained
from the analysis and compared with those of experiment in Figures 12.21 and 12.22,