
Page 305 - Handbook of Materials Failure Analysis
P. 305
6 Results and Discussion 301
× 10 –3
0.5
2
1 0.5 0.45
1.8
0.4
0.8 1.6 0.4
0.35
1.4
0.6 1.2 0.3 0.3
1 0.25
0.4 0.8 0.2 0.2
0.6 0.15
0.2 0.4 0.1 0.1
0.2 0.05
0 0 0
25.2 25.4 25.6 25.8 26 26.2 26.4 26.6 25.5 25.6 25.7 25.8 25.9 26 26.1 0
(a) (b)
1.5 0.5
0.45
0.4
0.35
1
0.3
0.25
0.2
0.5
0.15
0.1
0.05
0 0
25 25.3 25.6 25.9 26.2 26.5
(c)
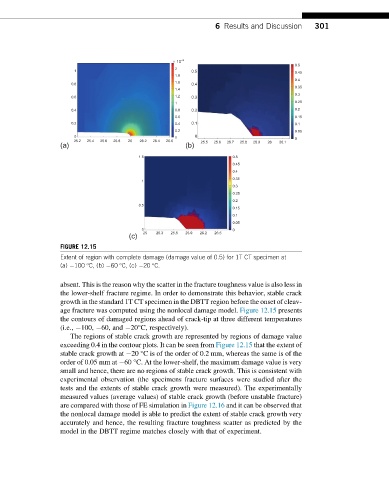
FIGURE 12.15
Extent of region with complete damage (damage value of 0.5) for 1T CT specimen at
(a) 100 °C, (b) 60 °C, (c) 20 °C.
absent. This is the reason why the scatter in the fracture toughness value is also less in
the lower-shelf fracture regime. In order to demonstrate this behavior, stable crack
growth in the standard 1T CT specimen in the DBTT region before the onset of cleav-
age fracture was computed using the nonlocal damage model. Figure 12.15 presents
the contours of damaged regions ahead of crack-tip at three different temperatures
(i.e., 100, 60, and 20°C, respectively).
The regions of stable crack growth are represented by regions of damage value
exceeding 0.4 in the contour plots. It can be seen from Figure 12.15 that the extent of
stable crack growth at 20 °C is of the order of 0.2 mm, whereas the same is of the
order of 0.05 mm at 60 °C. At the lower-shelf, the maximum damage value is very
small and hence, there are no regions of stable crack growth. This is consistent with
experimental observation (the specimens fracture surfaces were studied after the
tests and the extents of stable crack growth were measured). The experimentally
measured values (average values) of stable crack growth (before unstable fracture)
are compared with those of FE simulation in Figure 12.16 and it can be observed that
the nonlocal damage model is able to predict the extent of stable crack growth very
accurately and hence, the resulting fracture toughness scatter as predicted by the
model in the DBTT regime matches closely with that of experiment.