
Page 307 - Handbook of Materials Failure Analysis
P. 307
6 Results and Discussion 303
400
1T CT (P = 0.05)
f
Fracture toughness K JC (MPa m) 200 1T SEB (P = 0.05)
1T CT (P = 0.50)
f
1T CT (P = 0.95)
f
300
f
1T SEB (P = 0.50)
f
1T SEB (P = 0.95)
f
100
0
–100 –80 –60 –40 –20
Temperature (°C)
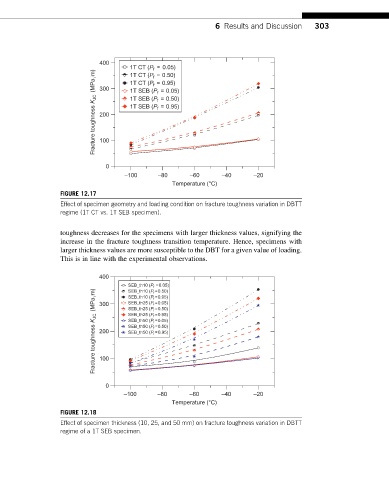
FIGURE 12.17
Effect of specimen geometry and loading condition on fracture toughness variation in DBTT
regime (1T CT vs. 1T SEB specimen).
toughness decreases for the specimens with larger thickness values, signifying the
increase in the fracture toughness transition temperature. Hence, specimens with
larger thickness values are more susceptible to the DBT for a given value of loading.
This is in line with the experimental observations.
400
SEB_th10 (P f =0.05)
Fracture toughness K JC (MPa m) 200 SEB_th25 (P f =0.50)
SEB_th10 (P f =0.50)
SEB_th10 (P f =0.95)
SEB_th25 (P f =0.05)
300
SEB_th25 (P f =0.95)
SEB_th50 (P f =0.05)
SEB_th50 (P f =0.50)
SEB_th50 (P f =0.95)
100
0
–100 –80 –60 –40 –20
Temperature (°C)
FIGURE 12.18
Effect of specimen thickness (10, 25, and 50 mm) on fracture toughness variation in DBTT
regime of a 1T SEB specimen.