
Page 306 - Handbook of Materials Failure Analysis
P. 306
302 CHAPTER 12 A nonlocal damage-mechanics-based approach
0.30
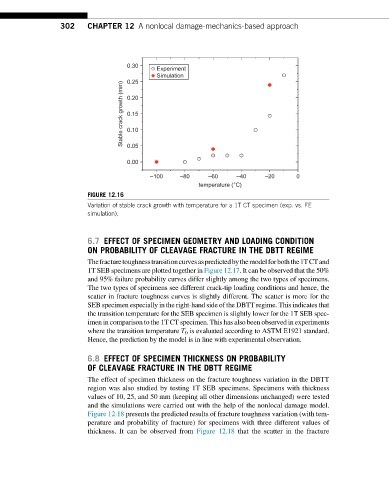
Experiment
Simulation
0.25
Stable crack growth (mm) 0.20
0.15
0.10
0.05
0.00
–100 –80 –60 –40 –20 0
temperature (°C)
FIGURE 12.16
Variation of stable crack growth with temperature for a 1T CT specimen (exp. vs. FE
simulation).
6.7 EFFECT OF SPECIMEN GEOMETRY AND LOADING CONDITION
ON PROBABILITY OF CLEAVAGE FRACTURE IN THE DBTT REGIME
Thefracturetoughnesstransitioncurvesaspredictedbythemodelforboththe1TCTand
1T SEB specimens are plotted together in Figure 12.17. It can be observed that the 50%
and 95% failure probability curves differ slightly among the two types of specimens.
The two types of specimens see different crack-tip loading conditions and hence, the
scatter in fracture toughness curves is slightly different. The scatter is more for the
SEB specimen especially in the right-hand side of the DBTT regime. This indicates that
the transition temperature for the SEB specimen is slightly lower for the 1T SEB spec-
imen in comparison to the 1T CT specimen. This has also been observed in experiments
where the transition temperature T 0 is evaluated according to ASTM E1921 standard.
Hence, the prediction by the model is in line with experimental observation.
6.8 EFFECT OF SPECIMEN THICKNESS ON PROBABILITY
OF CLEAVAGE FRACTURE IN THE DBTT REGIME
The effect of specimen thickness on the fracture toughness variation in the DBTT
region was also studied by testing 1T SEB specimens. Specimens with thickness
values of 10, 25, and 50 mm (keeping all other dimensions unchanged) were tested
and the simulations were carried out with the help of the nonlocal damage model.
Figure 12.18 presents the predicted results of fracture toughness variation (with tem-
perature and probability of fracture) for specimens with three different values of
thickness. It can be observed from Figure 12.18 that the scatter in the fracture