
Page 303 - Handbook of Materials Failure Analysis
P. 303
6 Results and Discussion 299
Figure 12.12 shows the predicted fracture toughness variation (with temperature)
for the deeply cracked 1T SEB specimen. FE analysis has been carried out using 3D
iso-parametric 20-noded brick elements. The mesh size near the crack-tip has been of
the order of 0.02 mm. The Weibull parameters (m and σ u ) used in the analysis are
34.6 and 2005 MPa, respectively. The crack-tip stress field as computed by the non-
local damage model has considered the effect of the ductile crack growth and hence,
the predicted fracture toughness scatter compares very well with that of experimental
data (Figure 12.12).
The master curves for fracture probability of 5% and 95% have also been plotted
along with the experimental and FE results in Figure 12.12. It can be observed that
the combined nonlocal ductile and cleavage fracture model has been able to predict
the experimental data of fracture toughness as well as the master curve very accu-
rately. However, the master curve requires the evaluation of the transition temper-
ature T 0 from experimental data and hence, this T 0 may be not applicable when
the fracture toughness variation of different types of specimens and components
are to be predicted. It will be shown in the following sections that the numerical
model as discussed in this work is able to predict the effect of specimen geometry,
size, crack-depth, loading types, etc., on the shape of the fracture toughness transition
in the DBTT region of ferritic pressure vessel steels.
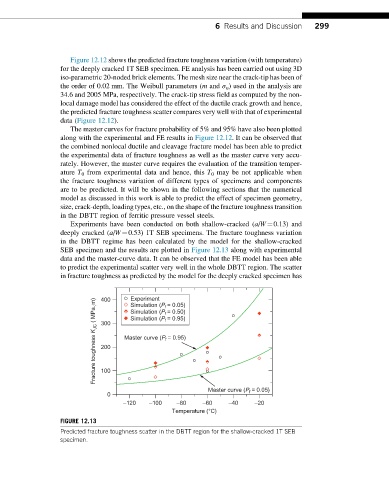
Experiments have been conducted on both shallow-cracked (a/W¼0.13) and
deeply cracked (a/W¼0.53) 1T SEB specimens. The fracture toughness variation
in the DBTT regime has been calculated by the model for the shallow-cracked
SEB specimen and the results are plotted in Figure 12.13 along with experimental
data and the master-curve data. It can be observed that the FE model has been able
to predict the experimental scatter very well in the whole DBTT region. The scatter
in fracture toughness as predicted by the model for the deeply cracked specimen has
Experiment
400
Fracture toughness K JC ( MPa m) 300 Master curve (P = 0.95)
Simulation (P = 0.05)
f
Simulation (P = 0.50)
f
Simulation (P = 0.95)
f
f
200
100
Master curve (P = 0.05)
f
0
–120 –100 –80 –60 –40 –20
Temperature (°C)
FIGURE 12.13
Predicted fracture toughness scatter in the DBTT region for the shallow-cracked 1T SEB
specimen.