
Page 298 - Handbook of Materials Failure Analysis
P. 298
294 CHAPTER 12 A nonlocal damage-mechanics-based approach
1600
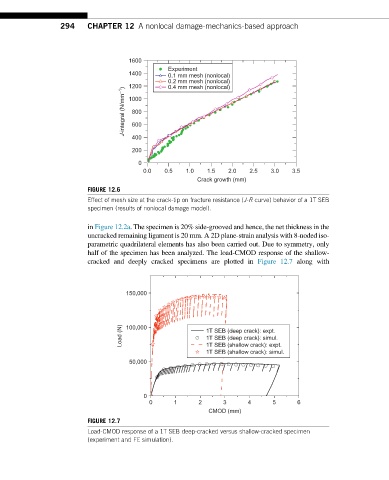
Experiment
1400 0.1 mm mesh (nonlocal)
0.2 mm mesh (nonlocal)
1200 0.4 mm mesh (nonlocal)
J-integral (N/mm –1 ) 1000
800
600
400
200
0
0.0 0.5 1.0 1.5 2.0 2.5 3.0 3.5
Crack growth (mm)
FIGURE 12.6
Effect of mesh size at the crack-tip on fracture resistance (J-R curve) behavior of a 1T SEB
specimen (results of nonlocal damage model).
in Figure 12.2a. The specimen is 20% side-grooved and hence, the net thickness in the
uncracked remaining ligament is 20 mm. A 2D plane-strain analysis with 8-noded iso-
parametric quadrilateral elements has also been carried out. Due to symmetry, only
half of the specimen has been analyzed. The load-CMOD response of the shallow-
cracked and deeply cracked specimens are plotted in Figure 12.7 along with
150,000
Load (N) 100,000 1T SEB (deep crack): expt.
1T SEB (deep crack): simul.
1T SEB (shallow crack): expt.
1T SEB (shallow crack): simul.
50,000
0
0 1 2 3 4 5 6
CMOD (mm)
FIGURE 12.7
Load-CMOD response of a 1T SEB deep-cracked versus shallow-cracked specimen
(experiment and FE simulation).