
Page 295 - Handbook of Materials Failure Analysis
P. 295
6 Results and Discussion 291
where a 0 is the initial crack length and Δa is the increment in crack length during
loading (it increases as one traverses the load-displacement curve). The geometric
factors η and γ depend upon the specimen geometry and crack length to width ratio
(a/W). For a standard CT specimen, η¼2+0.522(1 a/W) and γ ¼0.75η 1. For a
standard SEB specimen, η¼2 and γ ¼1. The load-CMOD and the J-integral versus
crack growth data for these specimens were obtained from the experiments and com-
pared with results of numerical simulation.
6 RESULTS AND DISCUSSION
Results of FE analysis of various types of specimens as discussed in the previous
section are presented in the following sections and the data are compared with those
of experiment wherever applicable. A summary of different parameters studied
in this work is given in Table 12.2.
6.1 EFFECT OF MESH SIZE ON THE LOAD DEFORMATION
AND FRACTURE RESISTANCE BEHAVIOR OF THE 1T SEB SPECIMEN
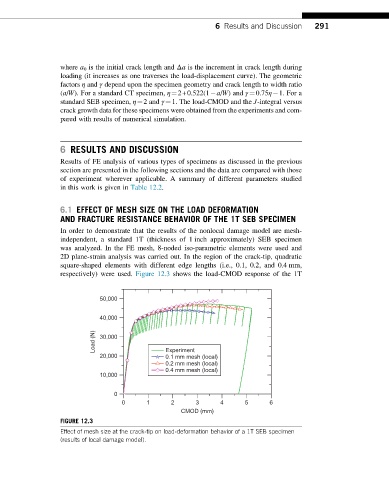
In order to demonstrate that the results of the nonlocal damage model are mesh-
independent, a standard 1T (thickness of 1 inch approximately) SEB specimen
was analyzed. In the FE mesh, 8-noded iso-parametric elements were used and
2D plane-strain analysis was carried out. In the region of the crack-tip, quadratic
square-shaped elements with different edge lengths (i.e., 0.1, 0.2, and 0.4 mm,
respectively) were used. Figure 12.3 shows the load-CMOD response of the 1T
50,000
40,000
Load (N) 30,000
20,000 Experiment
0.1 mm mesh (local)
0.2 mm mesh (local)
0.4 mm mesh (local)
10,000
0
0 1 2 3 4 5 6
CMOD (mm)
FIGURE 12.3
Effect of mesh size at the crack-tip on load-deformation behavior of a 1T SEB specimen
(results of local damage model).