
Page 296 - Handbook of Materials Failure Analysis
P. 296
292 CHAPTER 12 A nonlocal damage-mechanics-based approach
SEB specimen as computed using the local Rousselier’s model. The CMOD is mea-
sured at the extreme end of the crack mouth. The results of analysis with different
mesh sizes are also compared with the experimental data. It can be observed that
results of the local model with mesh size of 0.2 mm compares very well with that
of experiment though load values are slightly lower for the FE analysis for a given
value of CMOD. This is because of the use of 2D plane-strain elements in the FE
analysis where actual experimental condition corresponds to that of 3D.
The load-CMOD response for the case of 0.1-mm mesh size shows considerable
softening behavior and the load falls much more rapidly compared to that of exper-
iment. This is because of prediction of faster crack growth in the FE analysis com-
pared to that observed during experiment. This is the characteristic of local damage
or softening models where localization of damage takes place (due to loss of ellip-
ticity of the governing differential equation) in a narrow region which is decided by
the size of elements used in the analysis. The finer the mesh, the lesser the energy it
takes for damage accumulation and hence, faster the crack growth. For the analysis
with 0.4-mm element size at the crack-tip, the local damage model overestimates the
load value for a given value of CMOD as the predicted extent of crack growth is
lower compared to that actually observed in experiment. Hence, the results of local
damage models are highly sensitive to the size of discretization in the crack-tip
region. The use of nonlocal formulation with nonlocalization of the damage param-
eter avoids this problem as will be seen in the following sections.
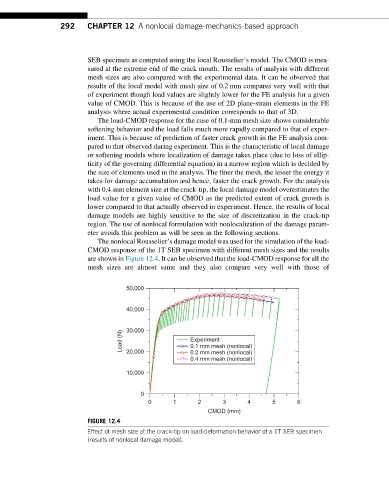
The nonlocal Rousselier’s damage model was used for the simulation of the load-
CMOD response of the 1T SEB specimen with different mesh sizes and the results
are shown in Figure 12.4. It can be observed that the load-CMOD response for all the
mesh sizes are almost same and they also compare very well with those of
50,000
40,000
Load (N) 30,000 Experiment
0.1 mm mesh (nonlocal)
20,000
0.2 mm mesh (nonlocal)
0.4 mm mesh (nonlocal)
10,000
0
0 1 2 3 4 5 6
CMOD (mm)
FIGURE 12.4
Effect of mesh size at the crack-tip on load-deformation behavior of a 1T SEB specimen
(results of nonlocal damage model).