
Page 297 - Handbook of Materials Failure Analysis
P. 297
6 Results and Discussion 293
1400
1200
J-integral (N/mm –1 ) 800
1000
600
Experiment
400
0.1 mm mesh (local)
200 0.2 mm mesh (local)
0.4 mm mesh (local)
0
0.0 0.5 1.0 1.5 2.0 2.5 3.0 3.5
Crack growth (mm)
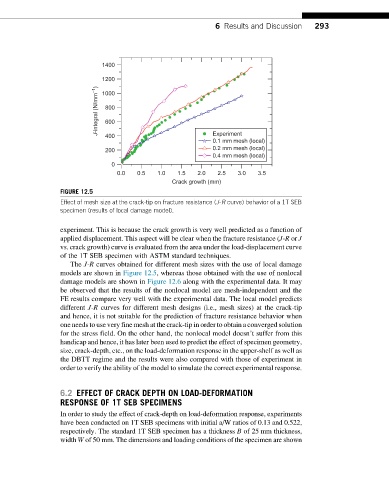
FIGURE 12.5
Effect of mesh size at the crack-tip on fracture resistance (J-R curve) behavior of a 1T SEB
specimen (results of local damage model).
experiment. This is because the crack growth is very well predicted as a function of
applied displacement. This aspect will be clear when the fracture resistance (J-R or J
vs. crack growth) curve is evaluated from the area under the load-displacement curve
of the 1T SEB specimen with ASTM standard techniques.
The J-R curves obtained for different mesh sizes with the use of local damage
models are shown in Figure 12.5, whereas those obtained with the use of nonlocal
damage models are shown in Figure 12.6 along with the experimental data. It may
be observed that the results of the nonlocal model are mesh-independent and the
FE results compare very well with the experimental data. The local model predicts
different J-R curves for different mesh designs (i.e., mesh sizes) at the crack-tip
and hence, it is not suitable for the prediction of fracture resistance behavior when
one needs to use very fine mesh at the crack-tip in order to obtain a converged solution
for the stress field. On the other hand, the nonlocal model doesn’t suffer from this
handicap and hence, it has later been used to predict the effect of specimen geometry,
size, crack-depth, etc., on the load-deformation response in the upper-shelf as well as
the DBTT regime and the results were also compared with those of experiment in
order to verify the ability of the model to simulate the correct experimental response.
6.2 EFFECT OF CRACK DEPTH ON LOAD-DEFORMATION
RESPONSE OF 1T SEB SPECIMENS
In order to study the effect of crack-depth on load-deformation response, experiments
have been conducted on 1T SEB specimens with initial a/W ratios of 0.13 and 0.522,
respectively. The standard 1T SEB specimen has a thickness B of 25 mm thickness,
width W of 50 mm. The dimensions and loading conditions of the specimen are shown