
Page 299 - Handbook of Materials Failure Analysis
P. 299
6 Results and Discussion 295
corresponding experimental data. Same parameters, as used for the analysis of the 1T
SEB deeply cracked specimen (a/W¼0.522), have been used here for simulation of 1T
SEB shallow-cracked specimen (a/W¼0.13). A very good correspondence of the FE
simulation results with those of experiment can be observed in Figure 12.7.Hence, the
capability of the nonlocal model to accurately predict the effect of crack-depth on the
load-CMOD response could be demonstrated in this work.
6.3 EFFECT OF GEOMETRY, SPECIMEN SIZE, AND LOADING
CONDITION ON THE LOAD-DEFORMATION RESPONSE
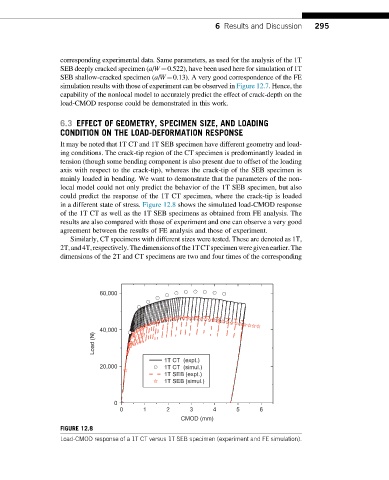
It may be noted that 1T CT and 1T SEB specimen have different geometry and load-
ing conditions. The crack-tip region of the CT specimen is predominantly loaded in
tension (though some bending component is also present due to offset of the loading
axis with respect to the crack-tip), whereas the crack-tip of the SEB specimen is
mainly loaded in bending. We want to demonstrate that the parameters of the non-
local model could not only predict the behavior of the 1T SEB specimen, but also
could predict the response of the 1T CT specimen, where the crack-tip is loaded
in a different state of stress. Figure 12.8 shows the simulated load-CMOD response
of the 1T CT as well as the 1T SEB specimens as obtained from FE analysis. The
results are also compared with those of experiment and one can observe a very good
agreement between the results of FE analysis and those of experiment.
Similarly, CT specimens with different sizes were tested. These are denoted as 1T,
2T,and4T,respectively.Thedimensionsofthe1TCTspecimenweregivenearlier.The
dimensions of the 2T and CT specimens are two and four times of the corresponding
60,000
40,000
Load (N)
1T CT (expt.)
20,000 1T CT (simul.)
1T SEB (expt.)
1T SEB (simul.)
0
0 1 2 3 4 5 6
CMOD (mm)
FIGURE 12.8
Load-CMOD response of a 1T CT versus 1T SEB specimen (experiment and FE simulation).