
Page 302 - Handbook of Materials Failure Analysis
P. 302
298 CHAPTER 12 A nonlocal damage-mechanics-based approach
400
Experiment f f
Fracture toughness K JC (MPa m) 200 Master curve (P = 0.95)
Simulation (P = 0.05)
Simulation (P = 0.50)
300
Simulation (P = 0.95)
f
f
100
Master curve (P = 0.05)
f
0
–100 –80 –60 –40 –20
Temperature (°C)
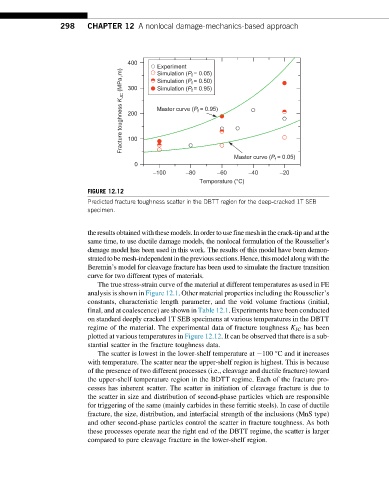
FIGURE 12.12
Predicted fracture toughness scatter in the DBTT region for the deep-cracked 1T SEB
specimen.
the results obtained with these models. In order to use fine mesh in the crack-tip and at the
same time, to use ductile damage models, the nonlocal formulation of the Rousselier’s
damage model has been used in this work. The results of this model have been demon-
strated to be mesh-independent in the previous sections. Hence, thismodel along with the
Beremin’s model for cleavage fracture has been used to simulate the fracture transition
curve for two different types of materials.
The true stress-strain curve of the material at different temperatures as used in FE
analysis is shown in Figure 12.1. Other material properties including the Rousselier’s
constants, characteristic length parameter, and the void volume fractions (initial,
final, and at coalescence) are shown in Table 12.1. Experiments have been conducted
on standard deeply cracked 1T SEB specimens at various temperatures in the DBTT
regime of the material. The experimental data of fracture toughness K JC has been
plotted at various temperatures in Figure 12.12. It can be observed that there is a sub-
stantial scatter in the fracture toughness data.
The scatter is lowest in the lower-shelf temperature at 100 °C and it increases
with temperature. The scatter near the upper-shelf region is highest. This is because
of the presence of two different processes (i.e., cleavage and ductile fracture) toward
the upper-shelf temperature region in the BDTT regime. Each of the fracture pro-
cesses has inherent scatter. The scatter in initiation of cleavage fracture is due to
the scatter in size and distribution of second-phase particles which are responsible
for triggering of the same (mainly carbides in these ferritic steels). In case of ductile
fracture, the size, distribution, and interfacial strength of the inclusions (MnS type)
and other second-phase particles control the scatter in fracture toughness. As both
these processes operate near the right end of the DBTT regime, the scatter is larger
compared to pure cleavage fracture in the lower-shelf region.