
Page 44 - Handbook of Materials Failure Analysis
P. 44
3 Case Studies 37
3.1.4 Critical review of process design
1. It was determined that no fluid was flowing in NFL300, acting as blind
section and there was continuous flow of spent caustic with a flow rate of
3
(V) 1.0-2.0 m /h from (1.5 in. diameter) CFL400 line. Based on steady state flow
conditions, the flow velocity (v¼V/A) of spent caustic solution was
0.24-0.490 m/s. The flow velocity was reduced to 0.0345-0.0690 m/s when
spent caustic enters the 4-in. diameter horizontal line.
2. The intermittent supply through 4-in. diameter IFL500 with a volumetric flow
3
rate of 8-10 m /h obtained a velocity of 0.276-0.345 m/s at the entrance of
damaged line pipe.
3. The intermittent flow of spent caustic when mixed with continuous supply, the
3
resultant flow rate was increased to 9-12 m /h beyond the “T” junction from
IFL toward the spent caustic storage tank and attained a flow velocity of
0.311-0.414 m/s.
4. The reduced flow velocity of (spent caustic from 0.24-0.490 to
0.0345-0.0690 m/s) from the T junction of CFL400 into the horizontal line pipe
could facilitate the settling of suspended solids in the solution at 6 O’clock
position and concentration aeration cell could form underneath it. Also the
reduced velocity at the junction of CFL400 could shield the surface by producing
stagnant conditions at the bottom surface of line pipe.
5. The high level of dissolved sodium chloride in spent caustic solution and
formation of aeration cells due to deposition of suspended solids accelerated the
pitting corrosion. The non-feeding line pipe (NFL300) also promoted the
deposition due to reduced flow velocity between two junctions.
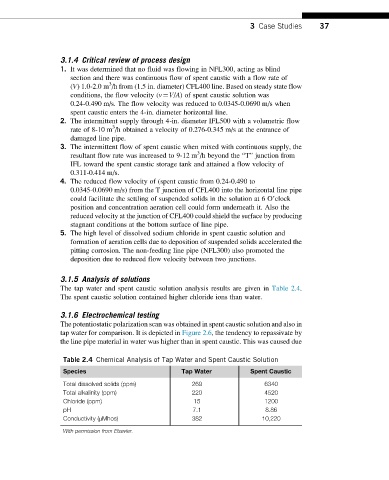
3.1.5 Analysis of solutions
The tap water and spent caustic solution analysis results are given in Table 2.4.
The spent caustic solution contained higher chloride ions than water.
3.1.6 Electrochemical testing
The potentiostatic polarization scan was obtained in spent caustic solution and also in
tap water for comparison. It is depicted in Figure 2.6, the tendency to repassivate by
the line pipe material in water was higher than in spent caustic. This was caused due
Table 2.4 Chemical Analysis of Tap Water and Spent Caustic Solution
Species Tap Water Spent Caustic
Total dissolved solids (ppm) 269 6340
Total alkalinity (ppm) 220 4520
Chloride (ppm) 15 1200
pH 7.1 8.86
Conductivity (μMhos) 382 10,220
With permission from Elsevier.