Page 264 - Handbook of Structural Steel Connection Design and Details
P. 264

Welded Joint Design and Production

                                                   Welded Joint Design and Production  249


                                   σ 2


                                ε  = zero
                                 2
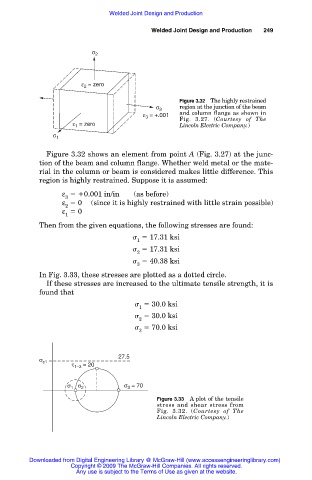
                                                           Figure 3.32 The highly restrained
                                                     σ 3   region at the junction of the beam
                                                 ε  = +.001  and column flange as shown in
                                                  3
                                                           Fig. 3.27. (Courtesy of The
                             ε  = zero                     Lincoln Electric Company.)
                              1
                        σ 1
                      Figure 3.32 shows an element from point A (Fig. 3.27) at the junc-
                    tion of the beam and column flange. Whether weld metal or the mate-
                    rial in the column or beam is considered makes little difference. This
                    region is highly restrained. Suppose it is assumed:
                           ε   0.001 in/in    (as before)
                           3
                           ε   0   (since it is highly restrained with little strain possible)
                           2
                           ε   0
                           1
                    Then from the given equations, the following stresses are found:
                                                  17.31 ksi
                                               1
                                                  17.31 ksi
                                               2
                                                  40.38 ksi
                                               3
                    In Fig. 3.33, these stresses are plotted as a dotted circle.
                      If these stresses are increased to the ultimate tensile strength, it is
                    found that
                                                   30.0 ksi
                                                1
                                                   30.0 ksi
                                                2
                                                   70.0 ksi
                                                3


                                          27.5
                    σ c1     τ 1–3  = 20


                            σ 1  σ 2        σ 3  = 70
                                                     Figure 3.33 A plot of the tensile
                                                     stress and shear stress from
                                                     Fig. 3.32. (Courtesy of The
                                                     Lincoln Electric Company.)


                 Downloaded from Digital Engineering Library @ McGraw-Hill (www.accessengineeringlibrary.com)
                             Copyright © 2009 The McGraw-Hill Companies. All rights reserved.
                              Any use is subject to the Terms of Use as given at the website.
   259   260   261   262   263   264   265   266   267   268   269