Page 263 - Handbook of Structural Steel Connection Design and Details
P. 263

Welded Joint Design and Production

                    248   Chapter Three

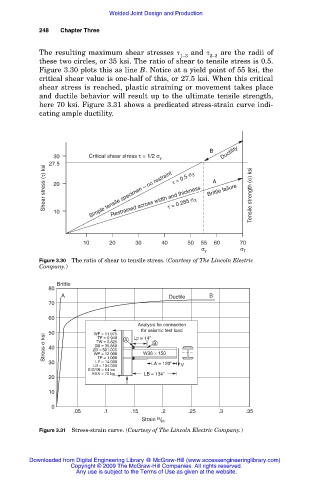
                    The resulting maximum shear stresses      and     are the radii of
                                                           1–3     2–3
                    these two circles, or 35 ksi. The ratio of shear to tensile stress is 0.5.
                    Figure 3.30 plots this as line B. Notice at a yield point of 55 ksi, the
                    critical shear value is one-half of this, or 27.5 ksi. When this critical
                    shear stress is reached, plastic straining or movement takes place
                    and ductile behavior will result up to the ultimate tensile strength,
                    here 70 ksi. Figure 3.31 shows a predicated stress-strain curve indi-
                    cating ample ductility.


                                                                   B   Ductility
                        30        Critical shear stress τ = 1/2 σ y
                      Shear stress (τ) ksi 27.5  Simple tensile specimen – no restraint τ = 0.285 σ 3  Brittle failure  Tensile strength (σ) ksi
                                                         τ = 0.5 σ 3
                                                                    A
                        20
                                        Restrained across width and thickness

                        10


                                10      20     30     40     50  55  60     70
                                                                 σ y        σ T
                    Figure 3.30 The ratio of shear to tensile stress. (Courtesy of The Lincoln Electric
                    Company.)

                         Brittle
                       80
                          A                             Ductile    B
                       70
                       60
                                                Analysis for connection
                                                for seismic test load
                      Stress σ ksi 50  ZB = 501.000  A  Lp = 14"  B
                                   WF = 11.975
                                    TF = 0.940
                                    TW = 0.825
                                    DB = 35.850
                       40
                                                 W36 × 150
                                   WP = 12.000
                                    TP = 1.000
                       30           LP = 14.000    LA = 120"
                                   LB = 134.000            V
                                  SIGYB = 54 ksi
                                   EXX = 70 ksi  LB = 134"
                       20
                       10
                        0
                              .05     .1      .15     .2     .25      .3     .35
                                                 Strain  in / in
                    Figure 3.31 Stress-strain curve. (Courtesy of The Lincoln Electric Company.)

                 Downloaded from Digital Engineering Library @ McGraw-Hill (www.accessengineeringlibrary.com)
                             Copyright © 2009 The McGraw-Hill Companies. All rights reserved.
                              Any use is subject to the Terms of Use as given at the website.
   258   259   260   261   262   263   264   265   266   267   268