Page 262 - Handbook of Structural Steel Connection Design and Details
P. 262

Welded Joint Design and Production

                                                   Welded Joint Design and Production  247
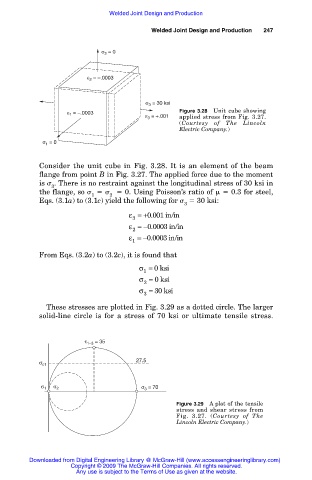
                                     σ 2  = 0


                                  ε 2  = –.0003


                                                  σ 3  = 30 ksi
                            ε 1  = –.0003                  Figure 3.28  Unit cube showing
                                                  ε 3  = +.001  applied stress from Fig. 3.27.
                                                           (Courtesy of The Lincoln
                                                           Electric Company.)
                     σ 1  = 0


                    Consider the unit cube in Fig. 3.28. It is an element of the beam
                    flange from point B in Fig. 3.27. The applied force due to the moment
                    is   . There is no restraint against the longitudinal stress of 30 ksi in
                        3
                    the flange, so        0. Using Poisson’s ratio of    0.3 for steel,
                                   1    2
                    Eqs. (3.1a) to (3.1c) yield the following for     30 ksi:
                                                            3
                                             ε =+ 0 001 in/in
                                                   .
                                              3
                                             ε =− 0 0003 in/in
                                                   .
                                              2
                                             ε =− 0 0003 in/in
                                                   .
                                                           n
                                              1
                    From Eqs. (3.2a) to (3.2c), it is found that
                                                σ =  0 ksi
                                                 1
                                                σ =  0 ksi
                                                 2
                                                σ =  30 ksi
                                                 3
                      These stresses are plotted in Fig. 3.29 as a dotted circle. The larger
                    solid-line circle is for a stress of 70 ksi or ultimate tensile stress.

                                 τ 1–3  = 35

                                               27.5
                    σ c1


                                                σ 3  = 70
                     σ 1  σ 2
                                                          Figure 3.29 A plot of the tensile
                                                          stress and shear stress from
                                                          Fig. 3.27. (Courtesy of The
                                                          Lincoln Electric Company.)


                 Downloaded from Digital Engineering Library @ McGraw-Hill (www.accessengineeringlibrary.com)
                             Copyright © 2009 The McGraw-Hill Companies. All rights reserved.
                              Any use is subject to the Terms of Use as given at the website.
   257   258   259   260   261   262   263   264   265   266   267