Page 399 - High Power Laser Handbook
P. 399

368     So l i d - S t at e   La s e r s                                                                          The National Ignition Facility Laser    369


                                       Average                         St Dev of
                                       Measured   Total     Deviation   Beamline
                  Shot      Desired    Beamline   Bundle    of Average   Energies
                  Sequence  1v Energy   1v Energy   1v Energy   from   from
                  Number    (kJ)       (kJ)       (kJ)      Desired (%)  Mean (%)
                  1         19.02      19.20      153.6     +0.98      0.84
                  2         "          19.15      153.2     +0.68      0.94
                  3         "          19.11      152.9     +0.50      0.67
                  4         "          19.10      152.8     +0.43      0.89
                 Table 14.1  Analysis of the 1ω Beam Energetics of Four Identical 19-kJ Shots


                      14.4.2  Power versus Energy Operating Envelopes for NIF
                      A system shot is defined as any event in which the flash lamps are
                      fired  in  a  bundle  with  all  of  the  bundle’s  main  laser  (1ω)  optics
                      installed. From commissioning the first four NIF beamlines in April
                      2001 to the time of the initial tests in 2006, NIF had fired more than
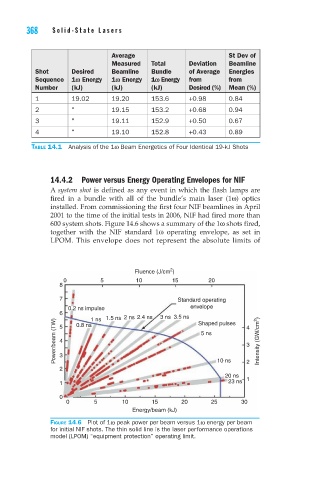
                      600 system shots. Figure 14.6 shows a summary of the 1ω shots fired,
                      together  with  the  NIF  standard  1ω  operating  envelope,  as  set  in
                      LPOM.  This  envelope  does  not  represent  the  absolute  limits  of


                                                       2
                                             Fluence (J/cm )
                          0         5        10        15        20
                         8
                         7                               Standard operating
                           0.2 ns impulse                   envelope
                         6 5  0.8 ns 1 ns 1.5 ns  2 ns 2.4 ns  3 ns 3.5 ns  Shaped pulses  4
                       Power/beam (TW)  4                      5 ns         3  Intensity (GW/cm 2 )


                         2 3                                        10 ns   2
                                                                      20 ns  1
                         1                                             23 ns
                         0
                          0       5       10      15      20      25      30
                                            Energy/beam (kJ)
                      Figure 14.6  Plot of 1ω peak power per beam versus 1ω energy per beam
                      for initial NIF shots. The thin solid line is the laser performance operations
                      model (LPOM) “equipment protection” operating limit.
   394   395   396   397   398   399   400   401   402   403   404