
Page 400 - High Power Laser Handbook
P. 400
368 So l i d - S t at e La s e r s The National Ignition Facility Laser 369
2
Fluence (J/cm )
0 2 4 6 8 10 12 14 16
4.5
0.2 ns impulse
4.0
Design operating
3.5 1 ns 1.5 ns 2 ns space
Power/beam (TW) 2.5 0.8 ns shaped shaped shaped
3.0
3.5 ns
PQ
1.0 MJ
2.0
1.8 MJ
1.5
1.0 5 ns
9 ns shaped
0.5
0
0 2 4 6 8 10 12 14
Energy/beam (kJ)
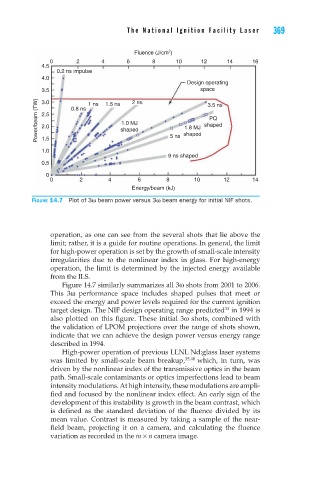
Figure 14.7 Plot of 3ω beam power versus 3ω beam energy for initial NIF shots.
operation, as one can see from the several shots that lie above the
limit; rather, it is a guide for routine operations. In general, the limit
for high-power operation is set by the growth of small-scale intensity
irregularities due to the nonlinear index in glass. For high-energy
operation, the limit is determined by the injected energy available
from the ILS.
Figure 14.7 similarly summarizes all 3ω shots from 2001 to 2006.
This 3ω performance space includes shaped pulses that meet or
exceed the energy and power levels required for the current ignition
33
target design. The NIF design operating range predicted in 1994 is
also plotted on this figure. These initial 3ω shots, combined with
the validation of LPOM projections over the range of shots shown,
indicate that we can achieve the design power versus energy range
described in 1994.
High-power operation of previous LLNL Nd:glass laser systems
was limited by small-scale beam breakup, 35,40 which, in turn, was
driven by the nonlinear index of the transmissive optics in the beam
path. Small-scale contaminants or optics imperfections lead to beam
intensity modulations. At high intensity, these modulations are ampli-
fied and focused by the nonlinear index effect. An early sign of the
development of this instability is growth in the beam contrast, which
is defined as the standard deviation of the fluence divided by its
mean value. Contrast is measured by taking a sample of the near-
field beam, projecting it on a camera, and calculating the fluence
variation as recorded in the m × n camera image.