
Page 401 - High Power Laser Handbook
P. 401
370 So l i d - S t at e La s e r s The National Ignition Facility Laser 371
2
(,
1 m n Fx y ) − F
Fluencebeamcontrast ≡ ∑ ∑ i j (14.1)
nm
= i 1 = j 1 F
(,
Fx y ) = Pixelated fluencefrromnear-fieldcameraimage“ ”
i j
F = Averageflueence of image
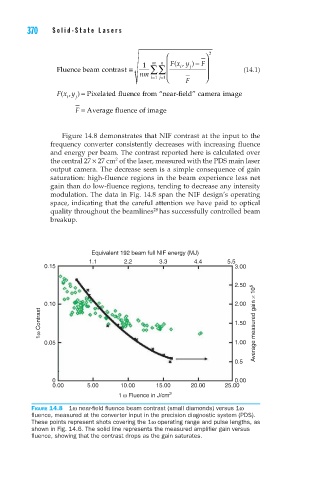
Figure 14.8 demonstrates that NIF contrast at the input to the
frequency converter consistently decreases with increasing fluence
and energy per beam. The contrast reported here is calculated over
2
the central 27 × 27 cm of the laser, measured with the PDS main laser
output camera. The decrease seen is a simple consequence of gain
saturation: high-fluence regions in the beam experience less net
gain than do low-fluence regions, tending to decrease any intensity
modulation. The data in Fig. 14.8 span the NIF design’s operating
space, indicating that the careful attention we have paid to optical
28
quality throughout the beamlines has successfully controlled beam
breakup.
Equivalent 192 beam full NIF energy (MJ)
1.1 2.2 3.3 4.4 5.5
0.15 3.00
2.50
0.10 2.00
1ω Contrast 1.50 Average measured gain × 10 5
0.05 1.00
0.5
0 0.00
0.00 5.00 10.00 15.00 20.00 25.00
1 ω Fluence in J/cm 2
Figure 14.8 1ω near-field fluence beam contrast (small diamonds) versus 1ω
fluence, measured at the converter input in the precision diagnostic system (PDS).
These points represent shots covering the 1ω operating range and pulse lengths, as
shown in Fig. 14.6. The solid line represents the measured amplifier gain versus
fluence, showing that the contrast drops as the gain saturates.