
Page 406 - High Power Laser Handbook
P. 406
374 So l i d - S t at e La s e r s The National Ignition Facility Laser 375
MPA Input MPA Output
Energy (mJ) Energy (J)
Requested 1.41 1.11
First PQ shot 1.40 1.09
First PQ deviation –0.7% –2%
Second PQ shot 1.40 1.02
Second PQ deviation –0.7% –8%
Table 14.2 Requested and Measured Energies at the Input and
Output of the MPA
9
The ILS’s overall energy gain is of the order 10 . LPOM uses both
off-line and online data analysis to maintain ILS models that have the
accuracy needed to predict the energetics of this high-gain system.
Table 14.2 shows a comparison of the modeled and measured ener-
gies at the input and output of the MPA for both PQ shots.
The input energy to the MPA is monitored at 1 Hz. It is main-
tained at the requested value by a closed-loop control, using attenua-
tion provided by the combined action of an adjustable half-wave
plate and a polarizer used in transmission. The closed-loop control
mechanism produces energies within ±2 percent of the request. The
LPOM’s MPA model is accurate to within ±5 percent for injected
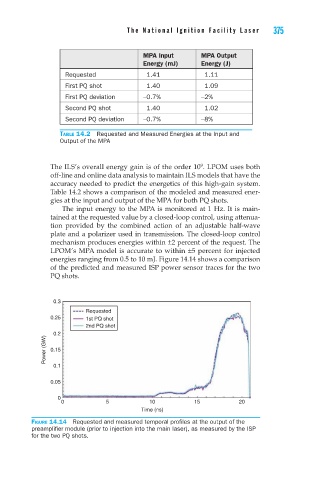
energies ranging from 0.5 to 10 mJ. Figure 14.14 shows a comparison
of the predicted and measured ISP power sensor traces for the two
PQ shots.
0.3
Requested
0.25 1st PQ shot
2nd PQ shot
0.2
Power (GW) 0.15
0.1
0.05
0
0 5 10 15 20
Time (ns)
Figure 14.14 Requested and measured temporal profiles at the output of the
preamplifier module (prior to injection into the main laser), as measured by the ISP
for the two PQ shots.