
Page 409 - High Power Laser Handbook
P. 409
378 So l i d - S t at e La s e r s The National Ignition Facility Laser 379
1
0.9
0.8
0.7 80% spot Farfield x Diffr.
Enclosed fraction 0.6 FF measurement, 1st PQ shot 14.5 0.11 5.7
Lim.
radius
strehl
( µ rad)
5.6
14.2
0.18
FF measurement, 2nd PQ shot
0.5
13.8
0.39
5.5
Radial shear, paraxial focus, 1st PQ shot
14.0
0.37
5.6
Radial shear, paraxial focus, 2nd PQ shot
0.4
0.3 LPOM calculation, paraxial focus, both shots 12.2 0.24 4.8
FF measurement, 1st PQ shot
0.2 FF measurement, 2nd PQ shot
Radial shear, paraxial focus, 1st PQ shot
0.1 Radial shear, paraxial focus, 2nd PQ shot
LPOM calculation, paraxial focus, both shots
0
0 5 10 15 20 25 30 35 40
Radius (µrad)
Figure 14.17 Enclosed 1ω focal spot energy fractions for the two PQ shots. Direct
far-field measurements as well as predictions based on reconstruction of the field
using the radial shear and near-field diagnostics are shown. The calculated far field
applies to both shots.
Intensity (GW/µrad 2 /TW) 25 5
20
15
10
0
40
0 40
y (µrad) −20 0 20
−40 −40
x (µrad)
(a) (b) (c)
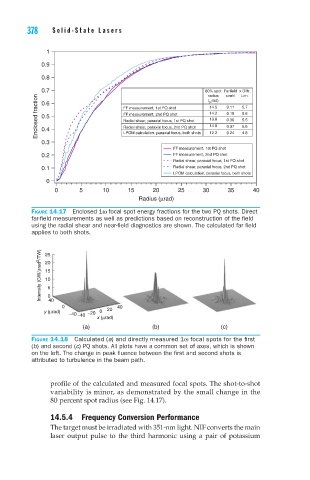
Figure 14.18 Calculated (a) and directly measured 1ω focal spots for the first
(b) and second (c) PQ shots. All plots have a common set of axes, which is shown
on the left. The change in peak fluence between the first and second shots is
attributed to turbulence in the beam path.
profile of the calculated and measured focal spots. The shot-to-shot
variability is minor, as demonstrated by the small change in the
80 percent spot radius (see Fig. 14.17).
14.5.4 Frequency Conversion Performance
The target must be irradiated with 351-nm light. NIF converts the main
laser output pulse to the third harmonic using a pair of potassium