
Page 412 - High Power Laser Handbook
P. 412
380 So l i d - S t at e La s e r s The National Ignition Facility Laser 381
12
10
Flat in Shaped
time pulse
8 pulses
3ω Energy out (kJ) 6
4
2
0
0 2 4 6 8 10 12 14 16 18
1ω Energy in (kJ)
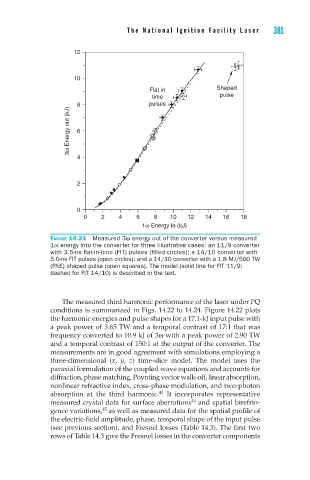
Figure 14.21 Measured 3ω energy out of the converter versus measured
1ω energy into the converter for three illustrative cases: an 11/9 converter
with 3.5-ns flat-in-time (FIT) pulses (filled circles); a 14/10 converter with
5.0-ns FIT pulses (open circles); and a 14/10 converter with a 1.8 MJ/500 TW
(FNE) shaped pulse (open squares). The model (solid line for FIT 11/9;
dashed for FIT 14/10) is described in the text.
The measured third harmonic performance of the laser under PQ
conditions is summarized in Figs. 14.22 to 14.24. Figure 14.22 plots
the harmonic energies and pulse shapes for a 17.1-kJ input pulse with
a peak power of 3.65 TW and a temporal contrast of 17:1 that was
frequency converted to 10.9 kJ of 3ω with a peak power of 2.90 TW
and a temporal contrast of 150:1 at the output of the converter. The
measurements are in good agreement with simulations employing a
three-dimensional (x, y, z) time-slice model. The model uses the
paraxial formulation of the coupled wave equations and accounts for
diffraction, phase matching, Poynting vector walk-off, linear absorption,
nonlinear refractive index, cross-phase modulation, and two-photon
absorption at the third harmonic. It incorporates representative
43
44
measured crystal data for surface aberrations and spatial birefrin-
gence variations, as well as measured data for the spatial profile of
45
the electric-field amplitude, phase, temporal shape of the input pulse
(see previous section), and Fresnel losses (Table 14.3). The first two
rows of Table 14.3 give the Fresnel losses in the converter components