
Page 408 - High Power Laser Handbook
P. 408
376 So l i d - S t at e La s e r s The National Ignition Facility Laser 377
0.15
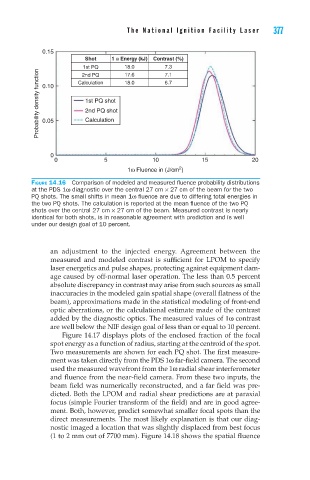
Shot 1 ω Energy (kJ) Contrast (%)
1st PQ 18.0 7.3
Probability density function 0.10 1st PQ shot
17.6
7.1
2nd PQ
18.0
Calculation
6.7
2nd PQ shot
Calculation
0.05
0
0 5 10 15 20
2
1ω Fluence in (J/cm )
Figure 14.16 Comparison of modeled and measured fluence probability distributions
at the PDS 1ω diagnostic over the central 27 cm × 27 cm of the beam for the two
PQ shots. The small shifts in mean 1ω fluence are due to differing total energies in
the two PQ shots. The calculation is reported at the mean fluence of the two PQ
shots over the central 27 cm × 27 cm of the beam. Measured contrast is nearly
identical for both shots, is in reasonable agreement with prediction and is well
under our design goal of 10 percent.
an adjustment to the injected energy. Agreement between the
measured and modeled contrast is sufficient for LPOM to specify
laser energetics and pulse shapes, protecting against equipment dam-
age caused by off-normal laser operation. The less than 0.5 percent
absolute discrepancy in contrast may arise from such sources as small
inaccuracies in the modeled gain spatial shape (overall flatness of the
beam), approximations made in the statistical modeling of front-end
optic aberrations, or the calculational estimate made of the contrast
added by the diagnostic optics. The measured values of 1ω contrast
are well below the NIF design goal of less than or equal to 10 percent.
Figure 14.17 displays plots of the enclosed fraction of the focal
spot energy as a function of radius, starting at the centroid of the spot.
Two measurements are shown for each PQ shot. The first measure-
ment was taken directly from the PDS 1ω far-field camera. The second
used the measured wavefront from the 1ω radial shear interferometer
and fluence from the near-field camera. From these two inputs, the
beam field was numerically reconstructed, and a far field was pre-
dicted. Both the LPOM and radial shear predictions are at paraxial
focus (simple Fourier transform of the field) and are in good agree-
ment. Both, however, predict somewhat smaller focal spots than the
direct measurements. The most likely explanation is that our diag-
nostic imaged a location that was slightly displaced from best focus
(1 to 2 mm out of 7700 mm). Figure 14.18 shows the spatial fluence