
Page 407 - High Power Laser Handbook
P. 407
376 So l i d - S t at e La s e r s The National Ignition Facility Laser 377
14.5.3 Main Laser 1v Performance
After the ISP, the pulse is injected into the main laser, the part of the
laser system that contains the full-aperture (40-cm) components. The
near-field and far-field spatial and temporal profiles at the 1ω output
of the main laser are modeled using the NIF virtual beamline (VBL)
propagation code, which has been incorporated into LPOM. LPOM
contains detailed information regarding sources of wavefront distor-
tion. All large optics undergo full-aperture, high-resolution interfer-
ometer measurements during their manufacture. This interferometry
data is used directly in the LPOM description for each optic at the
position in the chain where the optic is located. The distortion that is
induced as the laser slabs are deformed by nonuniform flash lamp
heating has been both calculated and measured; calculated aberra-
tions are used in LPOM. Calculated estimates for distortions due to
mounting stresses and a contribution for air turbulence in the ampli-
fier cavities are also included. Finally, a model of the 39-actuator, full-
aperture deformable mirror, using measured influence functions for
each actuator, is also used to represent the correction done online in
the Hartmann sensor/deformable mirror loop.
High-spatial-frequency wavefront errors generate corresponding
high-spatial-frequency intensity variations in the measured beam
profile. Lower-spatial-frequency wavefront errors (less than about
0.1/mm) affect spot size but not near-field intensity, because laser
propagation distances are insufficient for them to diffract into intensity
variations. The lower-spatial-frequency variations in the near-field
measurements are caused primarily by the input spatial shape, the
gain spatial profiles, and aberrations in the laser’s front end.
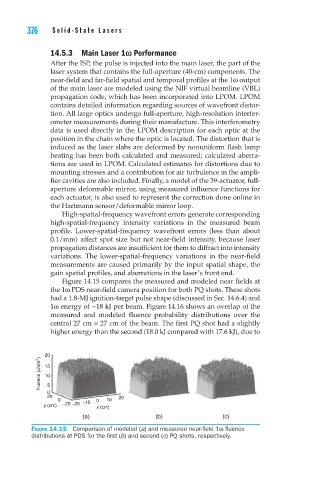
Figure 14.15 compares the measured and modeled near fields at
the 1ω PDS near-field camera position for both PQ shots. These shots
had a 1.8-MJ ignition-target pulse shape (discussed in Sec. 14.6.4) and
1ω energy of ~18 kJ per beam. Figure 14.16 shows an overlap of the
measured and modeled fluence probability distributions over the
central 27 cm × 27 cm of the beam. The first PQ shot had a slightly
higher energy than the second (18.0 kJ compared with 17.6 kJ), due to
Fluence (J/cm 2 ) 20
15
10
0 5
20 20
0 0 10
y (cm) −20 −20 −10 x (cm)
(a) (b) (c)
Figure 14.15 Comparison of modeled (a) and measured near-field 1ω fluence
distributions at PDS for the first (b) and second (c) PQ shots, respectively.