
Page 413 - High Power Laser Handbook
P. 413
382 So l i d - S t at e La s e r s The National Ignition Facility Laser 383
PQ shot N060329_003_999
3500 500
450
3000
400
2500 350
Power per beam (GW) 2000 300 192-beam power (TW)
250
1500
200
1000 Measured 1 ω 150
100
500 3 ω
Measured 50
and predicted
0 0
0 5 10 15 20
Time (ns)
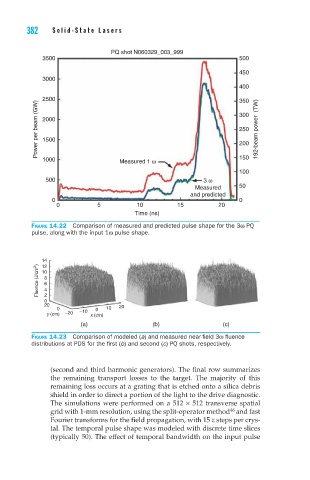
Figure 14.22 Comparison of measured and predicted pulse shape for the 3ω PQ
pulse, along with the input 1ω pulse shape.
14
Fluence (J/cm 2 ) 10 8 6 4
12
0 2
20 20
0 −10 0 10
y (cm) −20 x (cm)
(a) (b) (c)
Figure 14.23 Comparison of modeled (a) and measured near-field 3ω fluence
distributions at PDS for the first (b) and second (c) PQ shots, respectively.
(second and third harmonic generators). The final row summarizes
the remaining transport losses to the target. The majority of this
remaining loss occurs at a grating that is etched onto a silica debris
shield in order to direct a portion of the light to the drive diagnostic.
The simulations were performed on a 512 × 512 transverse spatial
grid with 1-mm resolution, using the split-operator method and fast
46
Fourier transforms for the field propagation, with 15 z steps per crys-
tal. The temporal pulse shape was modeled with discrete time slices
(typically 50). The effect of temporal bandwidth on the input pulse