
Page 414 - High Power Laser Handbook
P. 414
382 So l i d - S t at e La s e r s The National Ignition Facility Laser 383
0.1
Shot 3 ω Energy (kJ) Contrast (%)
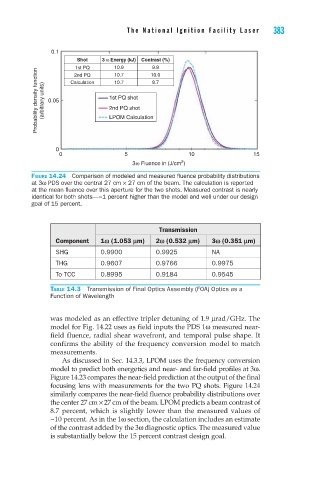
1st PQ 10.9 10.0
9.8
Probability density function (arbitrary units) 0.05 1st PQ shot
2nd PQ
10.7
8.7
10.7
Calculation
2nd PQ shot
LPOM Calculation
0
0 5 10 15
2
3ω Fluence in (J/cm )
Figure 14.24 Comparison of modeled and measured fluence probability distributions
at 3ω PDS over the central 27 cm × 27 cm of the beam. The calculation is reported
at the mean fluence over this aperture for the two shots. Measured contrast is nearly
identical for both shots—~1 percent higher than the model and well under our design
goal of 15 percent.
Transmission
Component 1v (1.053 lm) 2v (0.532 lm) 3v (0.351 lm)
SHG 0.9900 0.9925 NA
THG 0.9607 0.9766 0.9975
To TCC 0.8995 0.9184 0.9545
Table 14.3 Transmission of Final Optics Assembly (FOA) Optics as a
Function of Wavelength
was modeled as an effective tripler detuning of 1.9 μrad/GHz. The
model for Fig. 14.22 uses as field inputs the PDS 1ω measured near-
field fluence, radial shear wavefront, and temporal pulse shape. It
confirms the ability of the frequency conversion model to match
measurements.
As discussed in Sec. 14.3.3, LPOM uses the frequency conversion
model to predict both energetics and near- and far-field profiles at 3ω.
Figure 14.23 compares the near-field prediction at the output of the final
focusing lens with measurements for the two PQ shots. Figure 14.24
similarly compares the near-field fluence probability distributions over
the center 27 cm × 27 cm of the beam. LPOM predicts a beam contrast of
8.7 percent, which is slightly lower than the measured values of
~10 percent. As in the 1ω section, the calculation includes an estimate
of the contrast added by the 3ω diagnostic optics. The measured value
is substantially below the 15 percent contrast design goal.