
Page 415 - High Power Laser Handbook
P. 415
384 So l i d - S t at e La s e r s The National Ignition Facility Laser 385
1.0
0.9
0.8
0.7 FF measurement, 1st PQ
Enclosed fraction 0.6 Radial shear, paraxial focus, 1st PQ shot
FF measurement, 2nd PQ
Radial shear, paraxial focus, 2nd PQ shot
0.5
LPOM calculation, paraxial focus, both shots
0.4
strehl
Lim.
radius
(µrad)
0.3 80% spot Farfield x Diffr.
FF measurement, 1st PQ 14.2 0.012 16
FF measurement, 2nd PQ 15.1 0.013 17
0.2
Radial shear, paraxial focus, 1st PQ shot 12.5 0.021 14
Radial shear, paraxial focus, 2nd PQ shot 13.2 0.015 15
0.1
LPOM calculation, paraxial focus, both shots 12.8 0.017 15
0
0 5 10 15 20 25 30 35 40
Radius (µrad)
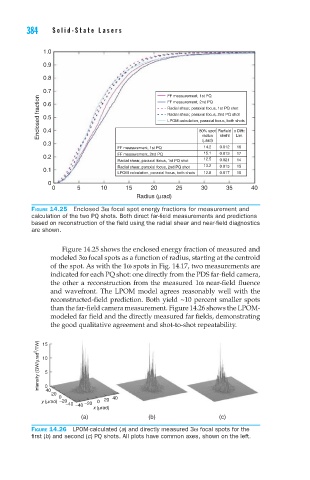
Figure 14.25 Enclosed 3ω focal spot energy fractions for measurement and
calculation of the two PQ shots. Both direct far-field measurements and predictions
based on reconstruction of the field using the radial shear and near-field diagnostics
are shown.
Figure 14.25 shows the enclosed energy fraction of measured and
modeled 3ω focal spots as a function of radius, starting at the centroid
of the spot. As with the 1ω spots in Fig. 14.17, two measurements are
indicated for each PQ shot: one directly from the PDS far-field camera,
the other a reconstruction from the measured 1ω near-field fluence
and wavefront. The LPOM model agrees reasonably well with the
reconstructed-field prediction. Both yield ~10 percent smaller spots
than the far-field camera measurement. Figure 14.26 shows the LPOM-
modeled far field and the directly measured far fields, demonstrating
the good qualitative agreement and shot-to-shot repeatability.
Intensity (GW/µrad 2 /TW) 10 5
15
0
40
20
0 40
y (µrad) −20 −20 0 20
−40 −40
x (µrad)
(a) (b) (c)
Figure 14.26 LPOM-calculated (a) and directly measured 3ω focal spots for the
first (b) and second (c) PQ shots. All plots have common axes, shown on the left.