
Page 108 - High Temperature Solid Oxide Fuel Cells Fundamentals, Design and Applications
P. 108
Electrolgtes 8 5
The dissolution of yttria into the fluorite phase of Zr02 can be written by the
following defect equation in Kroger-Vink notation [SI:
Yz03(Zr02) -+ 2Ybr + 30; + V, (1)
Each additional yttria molecule creates one oxygen vacancy. The
concentration of the vacancies is given simply by the electrical neutrality
condition, for this case, ~[Yz,'] = [V;.], implying that the vacancy concentration
is linearly dependent on the dopant level. The ionic conductivity, CT, can be
expressed by
cr = enp (2)
where n is the number of mobile oxide ion vacancies, ~1 their mobility, and e the
charge. In the case of oxide ion conductors such as doped zirconia and ceria, Eq.
(2) gives Eq. (3) with the fraction of mobile oxide ion vacancies, [V;.], and the
fraction of unoccupied oxide ion vacancies, [V,-]-l. To move through the
crystal, the ions must be able to move into an unoccupied equivalent site with a
minimum of hindrance, thus
CT = A/T[V;] ([V;]-')exp( -E/RT) (3)
where E is the activation energy for conduction, R the gas constant, T absolute
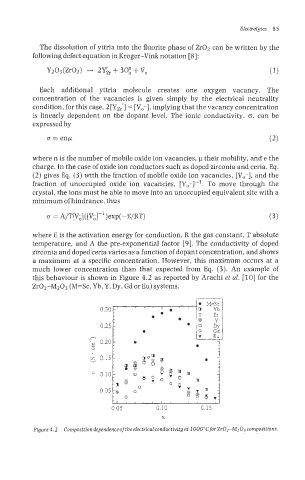
temperature, and A the pre-exponential factor [9]. The conductivity of doped
zirconia and doped ceria varies as a function of dopant concentration, and shows
a maximum at a specific concentration. However, this maximum occurs at a
much lower concentration than that expected from Eq. (3). An example of
this behaviour is shown in Figure 4.2 as reported by Arachi et al. [lo] for the
Zr02-M203 (M=Sc, Yb, Y, Dy, Gd or Eu) systems.
0
I , ( , , I I
0.05 0.10
X
Figure 4.2 Composition dependence ofthe electrical conductivity at IO00"C forZrOrM2O3 compositions.