
Page 152 - High Temperature Solid Oxide Fuel Cells Fundamentals, Design and Applications
P. 152
Cathodes 129
(LSC) layer into a (Ce,Ca)02-based electrolyte layer [43]. Although some cation
diffusion is observed across the interface, the LSC/Ce02 interface is very clear in
the range of 100 nm from the interface. The oxygen isotope concentration shows
no gap at the interface from LSC to CeOz, while the isotope oxygen concentration
at the gas phase and the LSC surface is considerably different. This suggests that
the rate-determining step for cathode reaction is the surface reaction process
at the 02/LSC surface: that is, step (i) is the slowest among the elemental steps.
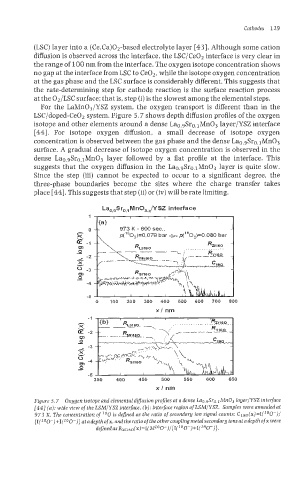
For the LaMn03/YSZ system, the oxygen transport is different than in the
LSC/doped-Ce02 system. Figure 5.7 shows depth diffusion profiles of the oxygen
isotope and other elements around a dense Lao.9Sro.lMn03 layer/YSZ interface
[44]. For isotope oxygen diffusion, a small decrease of isotope oxygen
concentration is observed between the gas phase and the dense Lao.9Sro.lMn03
surface. A gradual decrease of isotope oxygen concentration is observed in the
dense Lao.9Sro.lMn03 layer followed by a flat profile at the interface. This
suggests that the oxygen diffusion in the Lao.9Sro.lMn03 layer is quite slow.
Since the step (iii) cannot be expected to occur to a significant degree, the
three-phase boundaries become the sites where the charge transfer takes
place [44]. This suggests that step (ii) or (iv) will be rate limiting.
1 1 , I
(a 1
__ 973 K - 600 sec.. -
?z ’, p(’60,)=0.079 bar +-p(’80,)=0.080 bar
0
-1
rn
-
0
-2
X
I
0 -3
cn
-
0
-4
-5
o loo zoo 300 400 500 6aa 700 sa0
xl nm
-1
x
E -2
0 -
cn
-3
X
I
u
m -4
-
0
-5
350 400 450 500 550 600 650
x/ nm
Figure 5.7 Oxygen isotope and elemental diffusion profiles at a dense Lao,@ro,lMnO3 IayerJYSZ interface
[44] (a): wide view ofthe LSMIYSZ interface, (b): interface region ofLSMIYSZ. Samples were annealed at
973 K. The concentration of I8O is dejhed as the ratio of secondary ion signal counts: C180(x~=I(1sO-)/
{I(1sO-)+I(160-)} atadepthofx, and the ratiooftheothercouplingmetalsecon~aryionsatadepth ofx were
dejnedas RMI ~o(~)=I(~160-)/~i(180-)fI(160-)}.