
Page 130 - Hydrocarbon Exploration and Production Second Edition
P. 130
Reservoir Description 117
a constant temperature. Hence, a more realistic movement on the pressure–
temperature plot is from point A to Au.
Now using a hydrocarbon component, say ethane, as an example, let us consider
the other parameter, volume, using a plot of pressure vs. specific volume (i.e. volume
per unit mass of the component, the inverse of the density). The process to be
described could be performed physically by placing the liquid sample into a closed
cell (PVT cell), and then reducing the pressure of the sample by withdrawing the
piston of the cell and increasing the volume contained by the sample.
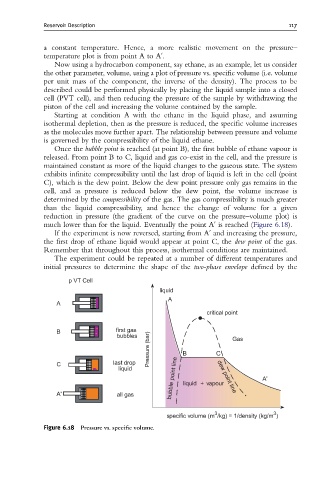
Starting at condition A with the ethane in the liquid phase, and assuming
isothermal depletion, then as the pressure is reduced, the specific volume increases
as the molecules move further apart. The relationship between pressure and volume
is governed by the compressibility of the liquid ethane.
Once the bubble point is reached (at point B), the first bubble of ethane vapour is
released. From point B to C, liquid and gas co-exist in the cell, and the pressure is
maintained constant as more of the liquid changes to the gaseous state. The system
exhibits infinite compressibility until the last drop of liquid is left in the cell (point
C), which is the dew point. Below the dew point pressure only gas remains in the
cell, and as pressure is reduced below the dew point, the volume increase is
determined by the compressibility of the gas. The gas compressibility is much greater
than the liquid compressibility, and hence the change of volume for a given
reduction in pressure (the gradient of the curve on the pressure–volume plot) is
much lower than for the liquid. Eventually the point Au is reached (Figure 6.18).
If the experiment is now reversed, starting from Au and increasing the pressure,
the first drop of ethane liquid would appear at point C, the dew point of the gas.
Remember that throughout this process, isothermal conditions are maintained.
The experiment could be repeated at a number of different temperatures and
initial pressures to determine the shape of the two-phase envelope defined by the
Figure 6.18 Pressure vs. speci¢c volume.