
Page 131 - Hydrocarbon Exploration and Production Second Edition
P. 131
118 Reservoir Fluids
bubble point line and the dew point line. These two lines meet at the critical point,
where it is no longer possible to distinguish between a compressed gas and a liquid.
It is important to remember the significance of the bubble point line, the dew
point line and the two-phase region, within which gas and liquid exist in equilibrium.
So far we have considered only a single component. However, reservoir fluids
contain a mixture of hundreds of components, which adds to the complexity of the
phase behaviour. Now consider the impact of adding one component to the ethane,
say n-heptane (C 7 H 16 ). We are now discussing a binary (two-component) mixture,
and will concentrate on the pressure–temperature phase diagram.
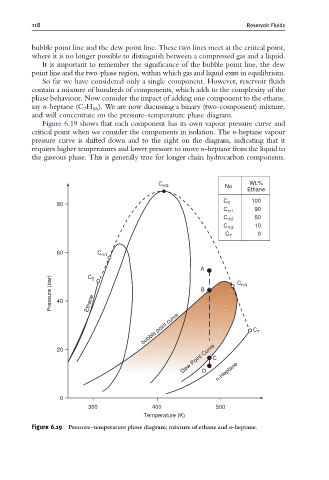
Figure 6.19 shows that each component has its own vapour pressure curve and
critical point when we consider the components in isolation. The n-heptane vapour
pressure curve is shifted down and to the right on the diagram, indicating that it
requires higher temperatures and lower pressure to move n-heptane from the liquid to
the gaseous phase. This is generally true for longer chain hydrocarbon components.
C m2 No Wt.%
Ethane
C 100
80 2
C m1 90
C m2 50
C m3 10
C 7 0
60 C m1
A
C
Pressure (bar) 40 Ethane B C m3
2
bubble point curve C 7
Dew Point Curve C n-Heptane
20
D
0
300 400 500
Temperature (K)
Figure 6.19 Pressure^temperature phase diagram; mixture of ethane and n-heptane.