
Page 129 - Hydrocarbon Exploration and Production Second Edition
P. 129
116 Reservoir Fluids
compressed
liquid
critical
point
P c
superheated
curve vapour
or gas
SOLID LIQUID
Pressure Melting point A B
VAPOUR
A'
triple
point
Temperature T
c
sublimation curve vapor pressure curve
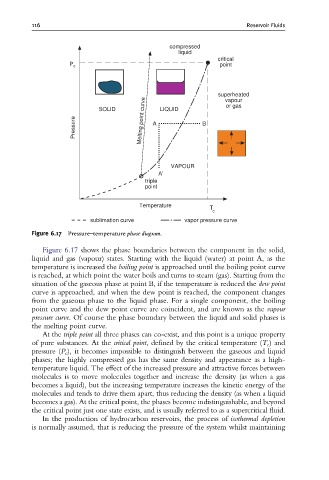
Figure 6.17 Pressure^temperature phase diagram.
Figure 6.17 shows the phase boundaries between the component in the solid,
liquid and gas (vapour) states. Starting with the liquid (water) at point A, as the
temperature is increased the boiling point is approached until the boiling point curve
is reached, at which point the water boils and turns to steam (gas). Starting from the
situation of the gaseous phase at point B, if the temperature is reduced the dew point
curve is approached, and when the dew point is reached, the component changes
from the gaseous phase to the liquid phase. For a single component, the boiling
point curve and the dew point curve are coincident, and are known as the vapour
pressure curve. Of course the phase boundary between the liquid and solid phases is
the melting point curve.
At the triple point all three phases can co-exist, and this point is a unique property
of pure substances. At the critical point, defined by the critical temperature (T c )and
pressure (P c ), it becomes impossible to distinguish between the gaseous and liquid
phases; the highly compressed gas has the same density and appearance as a high-
temperature liquid. The effect of the increased pressure and attractive forces between
molecules is to move molecules together and increase the density (as when a gas
becomes a liquid), but the increasing temperature increases the kinetic energy of the
molecules and tends to drive them apart, thus reducing the density (as when a liquid
becomes a gas). At the critical point, the phases become indistinguishable, and beyond
the critical point just one state exists, and is usually referred to as a supercritical fluid.
In the production of hydrocarbon reservoirs, the process of isothermal depletion
is normally assumed, that is reducing the pressure of the system whilst maintaining