
Page 171 - Hydrocarbon Exploration and Production Second Edition
P. 171
158 Data Interpretation
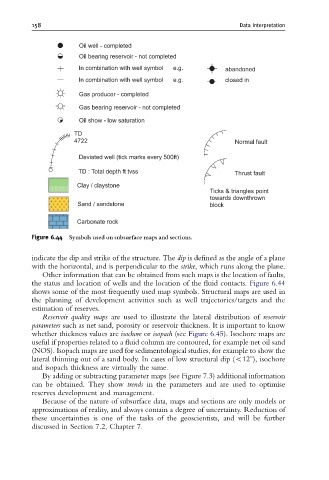
Figure 6.44 Symbols used on subsurface maps and sections.
indicate the dip and strike of the structure. The dip is defined as the angle of a plane
with the horizontal, and is perpendicular to the strike, which runs along the plane.
Other information that can be obtained from such maps is the location of faults,
the status and location of wells and the location of the fluid contacts. Figure 6.44
shows some of the most frequently used map symbols. Structural maps are used in
the planning of development activities such as well trajectories/targets and the
estimation of reserves.
Reservoir quality maps are used to illustrate the lateral distribution of reservoir
parameters such as net sand, porosity or reservoir thickness. It is important to know
whether thickness values are isochore or isopach (see Figure 6.45). Isochore maps are
useful if properties related to a fluid column are contoured, for example net oil sand
(NOS). Isopach maps are used for sedimentological studies, for example to show the
lateral thinning out of a sand body. In cases of low structural dip (o121), isochore
and isopach thickness are virtually the same.
By adding or subtracting parameter maps (see Figure 7.3) additional information
can be obtained. They show trends in the parameters and are used to optimise
reserves development and management.
Because of the nature of subsurface data, maps and sections are only models or
approximations of reality, and always contain a degree of uncertainty. Reduction of
these uncertainties is one of the tasks of the geoscientists, and will be further
discussed in Section 7.2, Chapter 7.