
Page 167 - Hydrocarbon Exploration and Production Second Edition
P. 167
154 Data Interpretation
Relative sea level changes affect many shallow marine and coastal depositional
environments.
Sequence stratigraphy integrates information gleaned from seismic, cores, well
logs and often outcrops. In many cases, it has increased the understanding of
reservoir geometry and heterogeneity and improved the correlation of individual
drainage units. Sequence stratigraphy has also proved a powerful tool to predict
presence and regional distribution of reservoirs. For instance, shallow marine
regressive surfaces may indicate the presence of turbidites in a nearby, deeper marine
area.
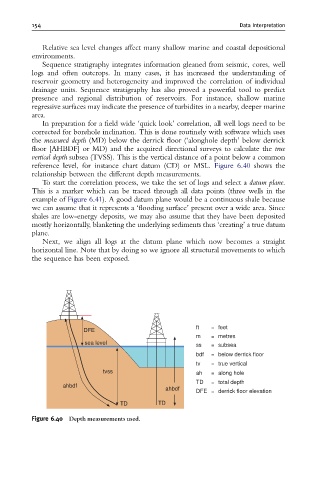
In preparation for a field wide ‘quick look’ correlation, all well logs need to be
corrected for borehole inclination. This is done routinely with software which uses
the measured depth (MD) below the derrick floor (‘alonghole depth’ below derrick
floor [AHBDF] or MD) and the acquired directional surveys to calculate the true
vertical depth subsea (TVSS). This is the vertical distance of a point below a common
reference level, for instance chart datum (CD) or MSL. Figure 6.40 shows the
relationship between the different depth measurements.
To start the correlation process, we take the set of logs and select a datum plane.
This is a marker which can be traced through all data points (three wells in the
example of Figure 6.41). A good datum plane would be a continuous shale because
we can assume that it represents a ‘flooding surface’ present over a wide area. Since
shales are low-energy deposits, we may also assume that they have been deposited
mostly horizontally, blanketing the underlying sediments thus ‘creating’ a true datum
plane.
Next, we align all logs at the datum plane which now becomes a straight
horizontal line. Note that by doing so we ignore all structural movements to which
the sequence has been exposed.
ft = feet
DFE
m = metres
sea level
ss = subsea
bdf = below derrick floor
tv = true vertical
tvss ah = along hole
TD = total depth
ahbdf
ahbdf DFE = derrick floor elevation
TD TD
Figure 6.40 Depth measurements used.