
Page 168 - Hydrocarbon Exploration and Production Second Edition
P. 168
Reservoir Description 155
Well 1 Well 2 Well 3
2500
Datum
2500
C-Marker
2500
Fault
D Sand
E Sand
2600
2600
2600
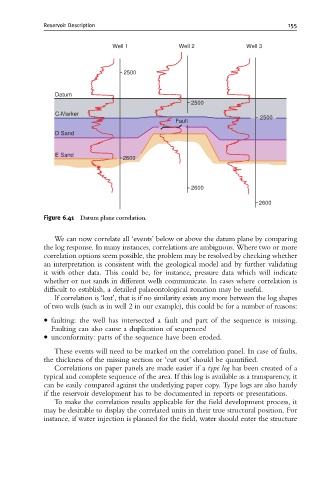
Figure 6.41 Datum plane correlation.
We can now correlate all ‘events’ below or above the datum plane by comparing
the log response. In many instances, correlations are ambiguous. Where two or more
correlation options seem possible, the problem may be resolved by checking whether
an interpretation is consistent with the geological model and by further validating
it with other data. This could be, for instance, pressure data which will indicate
whether or not sands in different wells communicate. In cases where correlation is
difficult to establish, a detailed palaeontological zonation may be useful.
If correlation is ‘lost’, that is if no similarity exists any more between the log shapes
of two wells (such as in well 2 in our example), this could be for a number of reasons:
faulting: the well has intersected a fault and part of the sequence is missing.
Faulting can also cause a duplication of sequences!
unconformity: parts of the sequence have been eroded.
These events will need to be marked on the correlation panel. In case of faults,
the thickness of the missing section or ‘cut out’ should be quantified.
Correlations on paper panels are made easier if a type log has been created of a
typical and complete sequence of the area. If this log is available as a transparency, it
can be easily compared against the underlying paper copy. Type logs are also handy
if the reservoir development has to be documented in reports or presentations.
To make the correlation results applicable for the field development process, it
may be desirable to display the correlated units in their true structural position. For
instance, if water injection is planned for the field, water should enter the structure