
Page 169 - Hydrocarbon Exploration and Production Second Edition
P. 169
156 Data Interpretation
Well 3
Well 2
Well 1
2500 2500 2500
Datum
Fault
C-Marker
D Sand
E Sand
2600 2600 2600
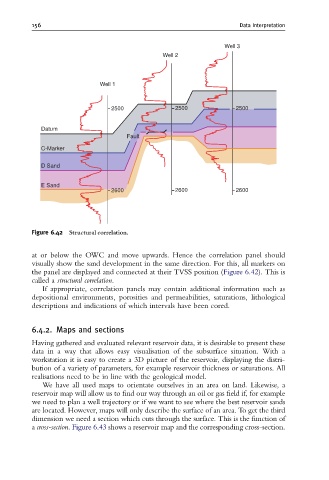
Figure 6.42 Structural correlation.
at or below the OWC and move upwards. Hence the correlation panel should
visually show the sand development in the same direction. For this, all markers on
the panel are displayed and connected at their TVSS position (Figure 6.42). This is
called a structural correlation.
If appropriate, correlation panels may contain additional information such as
depositional environments, porosities and permeabilities, saturations, lithological
descriptions and indications of which intervals have been cored.
6.4.2. Maps and sections
Having gathered and evaluated relevant reservoir data, it is desirable to present these
data in a way that allows easy visualisation of the subsurface situation. With a
workstation it is easy to create a 3D picture of the reservoir, displaying the distri-
bution of a variety of parameters, for example reservoir thickness or saturations. All
realisations need to be in line with the geological model.
We have all used maps to orientate ourselves in an area on land. Likewise, a
reservoir map will allow us to find our way through an oil or gas field if, for example
we need to plan a well trajectory or if we want to see where the best reservoir sands
are located. However, maps will only describe the surface of an area. To get the third
dimension we need a section which cuts through the surface. This is the function of
a cross-section. Figure 6.43 shows a reservoir map and the corresponding cross-section.