
Page 172 - Hydrocarbon Exploration and Production Second Edition
P. 172
Reservoir Description 159
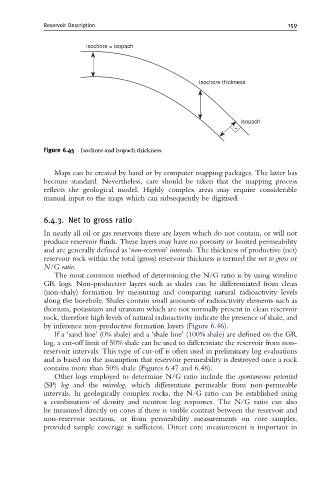
isochore = isopach
isochore thickness
isopach
•
Figure 6.45 Isochore and isopach thickness.
Maps can be created by hand or by computer mapping packages. The latter has
become standard. Nevertheless, care should be taken that the mapping process
reflects the geological model. Highly complex areas may require considerable
manual input to the maps which can subsequently be digitised.
6.4.3. Net to gross ratio
In nearly all oil or gas reservoirs there are layers which do not contain, or will not
produce reservoir fluids. These layers may have no porosity or limited permeability
and are generally defined as ‘non-reservoir’ intervals. The thickness of productive (net)
reservoir rock within the total (gross) reservoir thickness is termed the net to gross or
N/G ratio.
The most common method of determining the N/G ratio is by using wireline
GR logs. Non-productive layers such as shales can be differentiated from clean
(non-shaly) formation by measuring and comparing natural radioactivity levels
along the borehole. Shales contain small amounts of radioactivity elements such as
thorium, potassium and uranium which are not normally present in clean reservoir
rock, therefore high levels of natural radioactivity indicate the presence of shale, and
by inference non-productive formation layers (Figure 6.46).
If a ‘sand line’ (0% shale) and a ‘shale line’ (100% shale) are defined on the GR
log, a cut-off limit of 50% shale can be used to differentiate the reservoir from non-
reservoir intervals. This type of cut-off is often used in preliminary log evaluations
and is based on the assumption that reservoir permeability is destroyed once a rock
contains more than 50% shale (Figures 6.47 and 6.48).
Other logs employed to determine N/G ratio include the spontaneous potential
(SP) log and the microlog, which differentiate permeable from non-permeable
intervals. In geologically complex rocks, the N/G ratio can be established using
a combination of density and neutron log responses. The N/G ratio can also
be measured directly on cores if there is visible contrast between the reservoir and
non-reservoir sections, or from permeability measurements on core samples,
provided sample coverage is sufficient. Direct core measurement is important in