Page 173 - Hydrocarbon Exploration and Production Second Edition
P. 173

160                                                        Data Interpretation


                                        top of reservoir
                                                           5′
                                                           net


                                                           10′
                                                           net        20′
                                      bottom of reservoir            gross


                      productive                     N / G = 15 / 20 = 0.75
                      non-productive
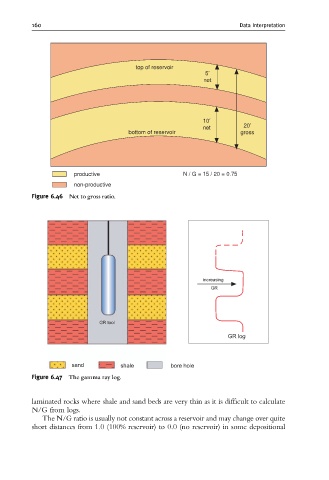
          Figure 6.46  Net to gross ratio.


          Figure 6.47  The gamma ray log.


          laminated rocks where shale and sand beds are very thin as it is difficult to calculate
          N/G from logs.
             The N/G ratio is usually not constant across a reservoir and may change over quite
          short distances from 1.0 (100% reservoir) to 0.0 (no reservoir) in some depositional
   168   169   170   171   172   173   174   175   176   177   178